
ACA Marketplace Plan Selections Fall 4.9% as Premiums Rise 19.7%

Health insurance shopping on the Affordable Care Act (ACA) marketplace looked different heading into 2026 than it did the year before, according to this ValuePenguin study.
Enrollment pulled back, monthly costs jumped and a growing share of shoppers gravitated toward the cheapest coverage tier available — all signs that the loss of enhanced federal subsidies is reshaping how (and whether) people buy coverage on the exchanges.
Here’s a closer look.
On this page
- Key findings
- Nationwide marketplace plan selections fell 4.9%
- Premiums rise 19.7% nationally
- New enrollee sign-ups drop even faster than overall enrollment
- Bronze plans now make up nearly 40% of all selections
- Vast majority of ACA enrollees are leaning on financial assistance
- How to choose affordable health insurance without sacrificing coverage
- Methodology
Key findings
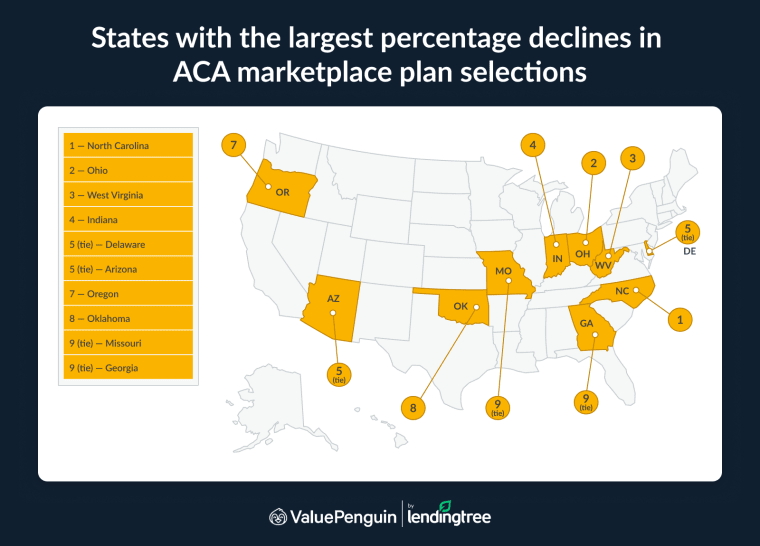
- Affordable Care Act (ACA) health insurance marketplace plan selections nationwide fell by 1.2 million, or 4.9%, from 24.3 million during the 2025 open enrollment period to 23.1 million during the 2026 open enrollment period. North Carolina had the steepest percentage decline in plan selections, at 21.9%, followed by Ohio at 19.5% and West Virginia at 16.7%.
- Average monthly premiums before advance premium tax credits rose 19.7% nationwide, from $619 in 2025 to $741 in 2026. Arkansas had the largest percentage increase at 42.0%. Meanwhile, West Virginia had the highest average premium in 2026, at $1,314.
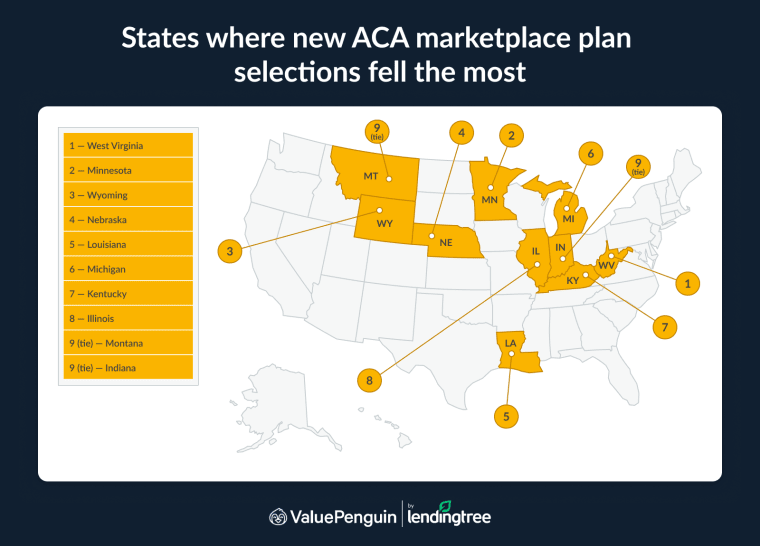
- New ACA marketplace consumer plan selections fell 12.7% nationwide, from 4.1 million in 2025 to 3.6 million in 2026. New consumers are those who selected a marketplace plan during open enrollment and weren’t classified as re-enrollees. West Virginia had the largest percentage drop in new consumer plan selections, at 44.1%, followed by Minnesota at 42.3% and Wyoming at 40.9%.
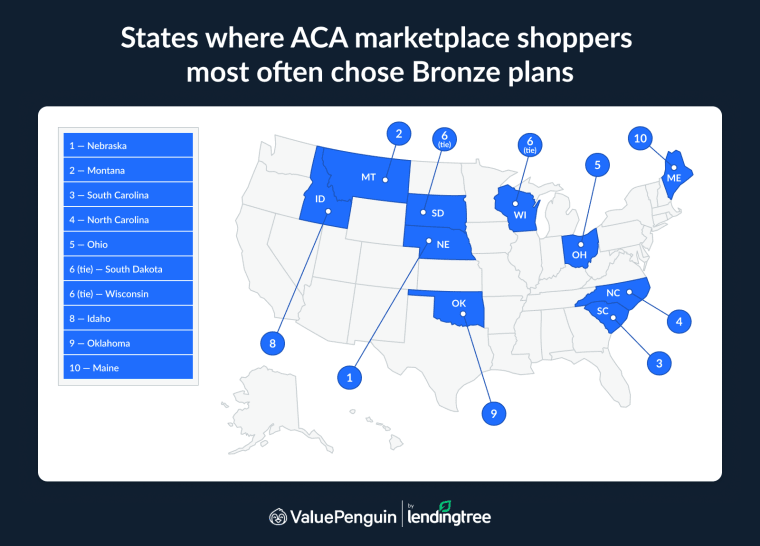
- Bronze plans accounted for 39.6% of all marketplace plan selections nationwide in 2026. Nebraska had the highest share of plan selections in the Bronze tier, at 65.9%, followed by Montana at 64.6% and South Carolina at 64.2%.
- Nationwide, 86.7% of consumers who selected an ACA marketplace plan in 2026 received financial assistance through advance premium tax credits, cost-sharing reductions or both. Mississippi had the highest share of plan selections receiving financial assistance, at 95.4%, followed by Florida at 94.7% and Texas at 93.0%.
Nationwide marketplace plan selections fell 4.9%
Marketplace plan selections dropped from 24.3 million during the 2025 open enrollment period to 23.1 million during the 2026 open enrollment period — a decline of 1.2 million, or 4.9%.
Note: The 2025 enrollment period ran from Nov. 1, 2024, through Jan. 15, 2025, while the 2026 period ran from Nov. 1, 2025, through Jan. 15, 2026. State-based exchanges may have different enrollment and reporting periods. In addition, Illinois moved from HealthCare.gov to its own state-based exchange for 2026, reducing the number of HealthCare.gov states from 31 to 30.
The pullback wasn’t even across the country. North Carolina saw the steepest percentage drop in marketplace plan selections at 21.9%, followed by Ohio at 19.5% and West Virginia at 16.7%. Notably, five of the top 10 states are in the South.
According to ValuePenguin health insurance expert Cate Deventer, there’s one clear driver for the decline.
"The biggest factor is plan costs, specifically the loss of the enhanced premium tax credits," she says. "These extra discounts had been in place since 2021 and allowed more people access to financial help. With the rollback of the extra discounts, fewer people get financial aid. At the same time, the underlying cost of a plan also increased. The combination of higher rates and fewer discounts makes it hard for some people to afford a plan."
Not every state moved in the same direction, though. In total, 10 states saw increases in plan selections between the enrollment periods in 2025 and 2026, with New Mexico (18.1%) being the only state to see a double-digit jump. That’s largely because it was the only state to fully replace the expired enhanced federal subsidies with state subsidies, according to KFF.
The District of Columbia (7.5%) and Texas (5.2%) saw the next largest increases.
Full rankings: States with the largest percentage declines/gains in ACA marketplace plan selections
Rank | State | Plan selections, 2025 | Plan selections, 2026 | # change | % change |
|---|---|---|---|---|---|
| 1 | North Carolina | 975,110 | 761,457 | -213,653 | -21.9% |
| 2 | Ohio | 583,443 | 469,616 | -113,827 | -19.5% |
| 3 | West Virginia | 67,113 | 55,879 | -11,234 | -16.7% |
| 4 | Indiana | 359,240 | 300,049 | -59,191 | -16.5% |
| 5 | Delaware | 52,931 | 44,663 | -8,268 | -15.6% |
| 5 | Arizona | 423,025 | 357,144 | -65,881 | -15.6% |
| 7 | Oregon | 139,688 | 118,372 | -21,316 | -15.3% |
| 8 | Oklahoma | 307,989 | 261,887 | -46,102 | -15.0% |
| 9 | Missouri | 417,000 | 365,734 | -51,266 | -12.3% |
| 9 | Georgia | 1,510,852 | 1,324,295 | -186,557 | -12.3% |
| 11 | Tennessee | 642,867 | 569,310 | -73,557 | -11.4% |
| 12 | Wyoming | 46,643 | 41,545 | -5,098 | -10.9% |
| 13 | Iowa | 136,833 | 123,304 | -13,529 | -9.9% |
| 14 | Maine | 64,678 | 58,523 | -6,155 | -9.5% |
| 15 | Alaska | 28,736 | 26,079 | -2,657 | -9.2% |
| 16 | Kentucky | 97,374 | 89,028 | -8,346 | -8.6% |
| 17 | Utah | 421,890 | 387,336 | -34,554 | -8.2% |
| 18 | Minnesota | 151,512 | 139,251 | -12,261 | -8.1% |
| 19 | Vermont | 32,862 | 30,344 | -2,518 | -7.7% |
| 20 | Mississippi | 338,159 | 313,392 | -24,767 | -7.3% |
| 21 | Wisconsin | 313,579 | 291,336 | -22,243 | -7.1% |
| 22 | South Carolina | 631,948 | 587,567 | -44,381 | -7.0% |
| 23 | South Dakota | 54,721 | 50,951 | -3,770 | -6.9% |
| 24 | Michigan | 531,083 | 497,064 | -34,019 | -6.4% |
| 25 | New Hampshire | 70,337 | 66,024 | -4,313 | -6.1% |
| 26 | Nebraska | 136,684 | 128,492 | -8,192 | -6.0% |
| 27 | Washington | 308,227 | 290,109 | -18,118 | -5.9% |
| 28 | Nevada | 110,687 | 104,286 | -6,401 | -5.8% |
| 29 | Montana | 77,221 | 73,255 | -3,966 | -5.1% |
| 30 | Hawaii | 24,606 | 23,380 | -1,226 | -5.0% |
| 31 | New York | 221,534 | 210,704 | -10,830 | -4.9% |
| 32 | Virginia | 388,856 | 370,086 | -18,770 | -4.8% |
| 33 | Alabama | 477,838 | 455,776 | -22,062 | -4.6% |
| 34 | North Dakota | 42,901 | 41,014 | -1,887 | -4.4% |
| 35 | Florida | 4,735,415 | 4,538,772 | -196,643 | -4.2% |
| 36 | Arkansas | 166,639 | 160,307 | -6,332 | -3.8% |
| 37 | Illinois | 465,985 | 448,568 | -17,417 | -3.7% |
| 38 | Kansas | 200,046 | 192,811 | -7,235 | -3.6% |
| 39 | California | 1,979,504 | 1,927,371 | -52,133 | -2.6% |
| 40 | Colorado | 282,481 | 277,238 | -5,243 | -1.9% |
| 41 | New Jersey | 513,217 | 509,192 | -4,025 | -0.8% |
| 42 | Pennsylvania | 496,661 | 501,459 | 4,798 | 1.0% |
| 43 | Louisiana | 292,994 | 296,648 | 3,654 | 1.2% |
| 44 | Idaho | 117,373 | 120,426 | 3,053 | 2.6% |
| 45 | Rhode Island | 42,117 | 43,446 | 1,329 | 3.2% |
| 46 | Maryland | 247,243 | 255,612 | 8,369 | 3.4% |
| 47 | Massachusetts | 389,191 | 403,624 | 14,433 | 3.7% |
| 47 | Connecticut | 151,151 | 156,745 | 5,594 | 3.7% |
| 49 | Texas | 3,966,226 | 4,172,233 | 206,007 | 5.2% |
| 50 | District of Columbia | 14,930 | 16,053 | 1,123 | 7.5% |
| 51 | New Mexico | 70,373 | 83,103 | 12,730 | 18.1% |
Source: ValuePenguin analysis of Centers for Medicare & Medicaid Services (CMS) Marketplace Open Enrollment Period Public Use Files from the 2025 and 2026 periods. Note: This refers to the number of consumers with an exchange plan selection during open enrollment.
Premiums rise 19.7% nationally
The average unsubsidized monthly premium rose from $619 in 2025 to $741 in 2026 — a 19.7% nationwide increase.
By state, Arkansas had the largest percentage jump at 42.0%, rising from $591 to $839. Mississippi followed, increasing 34.9% from $605 to $816. Kentucky rounded out the top three, rising 32.6% from $601 to $797.
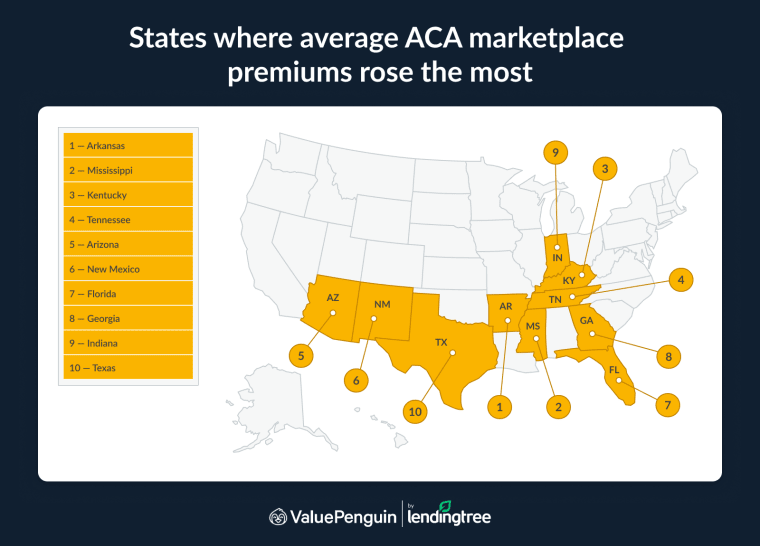
Meanwhile, West Virginia ($1,314), Wyoming ($1,217) and Vermont ($1,090) have the highest average premiums in 2026.
Deventer notes that higher healthcare costs play the largest role here, and lower premiums shouldn’t be your sole motivator when shopping for insurance.
"When insurers raise rates, it typically has to do with higher healthcare costs," she says. "Companies also likely expected lower marketplace enrollment because of the loss of the enhanced premium tax credits. Fewer people in the marketplaces means fewer people to spread costs across, which translates to higher rates for everyone left. But monthly rates are still not the only factor that shoppers should look at. Evaluate plans through the lens of your medical needs. If you need frequent, expensive or complex medical care, paying for a higher-cost plan could save you money in the long run."
On the other end of the list, average monthly premiums fell in just two states: Alaska (5.6%) and South Dakota (1.0%). In 2026, monthly average premiums are lowest in Idaho ($509), Maryland ($542) and New Hampshire ($553).
Full rankings: States where average ACA marketplace premiums rose/fell the most
Rank | State | Avg. monthly premium, 2025 | Avg. monthly premium, 2026 | $ change | % change |
|---|---|---|---|---|---|
| 1 | Arkansas | $591 | $839 | $248 | 42.0% |
| 2 | Mississippi | $605 | $816 | $211 | 34.9% |
| 3 | Kentucky | $601 | $797 | $196 | 32.6% |
| 4 | Tennessee | $634 | $838 | $204 | 32.2% |
| 5 | Arizona | $524 | $688 | $164 | 31.3% |
| 6 | New Mexico | $657 | $842 | $185 | 28.2% |
| 7 | Florida | $641 | $806 | $165 | 25.7% |
| 8 | Georgia | $620 | $777 | $157 | 25.3% |
| 9 | Indiana | $503 | $623 | $120 | 23.9% |
| 10 | Texas | $573 | $709 | $136 | 23.7% |
| 11 | Michigan | $540 | $657 | $117 | 21.7% |
| 12 | Illinois | $674 | $816 | $142 | 21.1% |
| 13 | Wyoming | $1,006 | $1,217 | $211 | 21.0% |
| 14 | Minnesota | $529 | $639 | $110 | 20.8% |
| 15 | Maine | $758 | $913 | $155 | 20.4% |
| 16 | Delaware | $749 | $901 | $152 | 20.3% |
| 17 | Kansas | $649 | $779 | $130 | 20.0% |
| 18 | Nevada | $555 | $659 | $104 | 18.7% |
| 19 | North Carolina | $637 | $755 | $118 | 18.5% |
| 20 | Louisiana | $642 | $759 | $117 | 18.2% |
| 21 | Colorado | $570 | $673 | $103 | 18.1% |
| 22 | Oklahoma | $616 | $727 | $111 | 18.0% |
| 23 | New Hampshire | $469 | $553 | $84 | 17.9% |
| 24 | Virginia | $489 | $575 | $86 | 17.6% |
| 25 | Washington | $629 | $738 | $109 | 17.3% |
| 26 | Missouri | $621 | $724 | $103 | 16.6% |
| 27 | Nebraska | $687 | $800 | $113 | 16.4% |
| 28 | Montana | $634 | $729 | $95 | 15.0% |
| 29 | Ohio | $580 | $665 | $85 | 14.7% |
| 30 | Alabama | $649 | $743 | $94 | 14.5% |
| 30 | South Carolina | $572 | $655 | $83 | 14.5% |
| 32 | Rhode Island | $568 | $649 | $81 | 14.3% |
| 33 | Wisconsin | $687 | $784 | $97 | 14.1% |
| 34 | Pennsylvania | $655 | $742 | $87 | 13.3% |
| 35 | West Virginia | $1,170 | $1,314 | $144 | 12.3% |
| 36 | Connecticut | $918 | $1,030 | $112 | 12.2% |
| 37 | Utah | $514 | $571 | $57 | 11.1% |
| 38 | Massachusetts | $535 | $594 | $59 | 11.0% |
| 39 | Iowa | $555 | $615 | $60 | 10.8% |
| 40 | District of Columbia | $739 | $815 | $76 | 10.3% |
| 41 | Maryland | $492 | $542 | $50 | 10.2% |
| 42 | New Jersey | $673 | $734 | $61 | 9.1% |
| 43 | California | $686 | $737 | $51 | 7.4% |
| 44 | Hawaii | $729 | $778 | $49 | 6.7% |
| 45 | Oregon | $696 | $741 | $45 | 6.5% |
| 46 | Idaho | $482 | $509 | $27 | 5.6% |
| 47 | New York | $791 | $812 | $21 | 2.7% |
| 48 | Vermont | $1,067 | $1,090 | $23 | 2.2% |
| 49 | North Dakota | $585 | $591 | $6 | 1.0% |
| 50 | South Dakota | $691 | $684 | -$7 | -1.0% |
| 51 | Alaska | $1,105 | $1,043 | -$62 | -5.6% |
Source: ValuePenguin analysis of CMS Marketplace Open Enrollment Period Public Use Files from the 2025 and 2026 periods. Notes: These are the average monthly premiums before advance premium tax credits. Rankings are based on percentage changes.
Full rankings: States where average ACA marketplace premiums are the highest/lowest
Rank | State | Avg. monthly premium, 2026 |
|---|---|---|
| 1 | West Virginia | $1,314 |
| 2 | Wyoming | $1,217 |
| 3 | Vermont | $1,090 |
| 4 | Alaska | $1,043 |
| 5 | Connecticut | $1,030 |
| 6 | Maine | $913 |
| 7 | Delaware | $901 |
| 8 | New Mexico | $842 |
| 9 | Arkansas | $839 |
| 10 | Tennessee | $838 |
| 11 | Mississippi | $816 |
| 11 | Illinois | $816 |
| 13 | District of Columbia | $815 |
| 14 | New York | $812 |
| 15 | Florida | $806 |
| 16 | Nebraska | $800 |
| 17 | Kentucky | $797 |
| 18 | Wisconsin | $784 |
| 19 | Kansas | $779 |
| 20 | Hawaii | $778 |
| 21 | Georgia | $777 |
| 22 | Louisiana | $759 |
| 23 | North Carolina | $755 |
| 24 | Alabama | $743 |
| 25 | Pennsylvania | $742 |
| 26 | Oregon | $741 |
| 27 | Washington | $738 |
| 28 | California | $737 |
| 29 | New Jersey | $734 |
| 30 | Montana | $729 |
| 31 | Oklahoma | $727 |
| 32 | Missouri | $724 |
| 33 | Texas | $709 |
| 34 | Arizona | $688 |
| 35 | South Dakota | $684 |
| 36 | Colorado | $673 |
| 37 | Ohio | $665 |
| 38 | Nevada | $659 |
| 39 | Michigan | $657 |
| 40 | South Carolina | $655 |
| 41 | Rhode Island | $649 |
| 42 | Minnesota | $639 |
| 43 | Indiana | $623 |
| 44 | Iowa | $615 |
| 45 | Massachusetts | $594 |
| 46 | North Dakota | $591 |
| 47 | Virginia | $575 |
| 48 | Utah | $571 |
| 49 | New Hampshire | $553 |
| 50 | Maryland | $542 |
| 51 | Idaho | $509 |
Source: ValuePenguin analysis of CMS Marketplace Open Enrollment Period Public Use Files from the 2026 period. Note: These are the average monthly premiums before advance premium tax credits.
New enrollee sign-ups drop even faster than overall enrollment
While ACA marketplace plan selections fell significantly, that falloff was especially pronounced among first-time shoppers. New consumer plan selections — people enrolling for the first time rather than renewing existing coverage — fell 12.7% nationwide, from 4.1 million in 2025 to 3.6 million in 2026.
By state, West Virginia (44.1%) had the largest percentage decline in new consumer plan selections. Minnesota (42.3%) and Wyoming (40.9%) followed.
Deventer points to affordability as the likely culprit. "Higher plan costs are likely creating a barrier to entry for new enrollees," she says. "Especially for new enrollees who aren’t used to shouldering the cost of health insurance, a high monthly rate could be a significant deterrent."
Meanwhile, six states saw an increase in new enrollee sign-ups, with Rhode Island (32.4%) and Mississippi (29.7%) in particular seeing large jumps. Other states with increases included New Mexico (14.9%), Texas (7.9%), the District of Columbia (2.6%) and Florida (0.3%).
Full rankings: States where new ACA marketplace plan selections fell/rose the most
Rank | State | New plan selections, 2025 | New plan selections, 2026 | # change | % change |
|---|---|---|---|---|---|
| 1 | West Virginia | 12,378 | 6,922 | -5,456 | -44.1% |
| 2 | Minnesota | 42,289 | 24,417 | -17,872 | -42.3% |
| 3 | Wyoming | 9,319 | 5,503 | -3,816 | -40.9% |
| 4 | Nebraska | 23,369 | 14,833 | -8,536 | -36.5% |
| 5 | Louisiana | 49,243 | 31,342 | -17,901 | -36.4% |
| 6 | Michigan | 97,493 | 64,637 | -32,856 | -33.7% |
| 7 | Kentucky | 23,493 | 15,624 | -7,869 | -33.5% |
| 8 | Illinois | 111,081 | 74,773 | -36,308 | -32.7% |
| 9 | Montana | 15,404 | 10,443 | -4,961 | -32.2% |
| 9 | Indiana | 63,327 | 42,907 | -20,420 | -32.2% |
| 11 | California | 345,711 | 235,055 | -110,656 | -32.0% |
| 11 | Vermont | 3,663 | 2,492 | -1,171 | -32.0% |
| 13 | Utah | 67,471 | 46,063 | -21,408 | -31.7% |
| 14 | New Jersey | 112,699 | 77,970 | -34,729 | -30.8% |
| 15 | Delaware | 9,732 | 6,758 | -2,974 | -30.6% |
| 16 | Oregon | 23,703 | 16,801 | -6,902 | -29.1% |
| 17 | North Dakota | 7,354 | 5,230 | -2,124 | -28.9% |
| 17 | Missouri | 65,059 | 46,284 | -18,775 | -28.9% |
| 19 | Iowa | 24,369 | 17,687 | -6,682 | -27.4% |
| 20 | Ohio | 99,034 | 73,309 | -25,725 | -26.0% |
| 21 | Arizona | 76,584 | 56,742 | -19,842 | -25.9% |
| 22 | Wisconsin | 53,265 | 39,582 | -13,683 | -25.7% |
| 23 | Maine | 11,285 | 8,577 | -2,708 | -24.0% |
| 24 | Colorado | 49,047 | 37,335 | -11,712 | -23.9% |
| 25 | Kansas | 34,577 | 26,335 | -8,242 | -23.8% |
| 26 | South Dakota | 8,689 | 6,685 | -2,004 | -23.1% |
| 27 | Nevada | 26,852 | 20,911 | -5,941 | -22.1% |
| 28 | Idaho | 20,410 | 15,959 | -4,451 | -21.8% |
| 29 | Oklahoma | 42,750 | 33,769 | -8,981 | -21.0% |
| 30 | Alaska | 5,735 | 4,584 | -1,151 | -20.1% |
| 31 | Hawaii | 5,143 | 4,130 | -1,013 | -19.7% |
| 32 | Arkansas | 36,976 | 29,746 | -7,230 | -19.6% |
| 33 | Alabama | 74,133 | 60,346 | -13,787 | -18.6% |
| 34 | South Carolina | 102,091 | 84,654 | -17,437 | -17.1% |
| 35 | Virginia | 69,335 | 58,469 | -10,866 | -15.7% |
| 35 | New York | 37,813 | 31,868 | -5,945 | -15.7% |
| 37 | Georgia | 227,569 | 192,032 | -35,537 | -15.6% |
| 38 | Maryland | 54,255 | 47,815 | -6,440 | -11.9% |
| 39 | Tennessee | 105,348 | 92,921 | -12,427 | -11.8% |
| 40 | Washington | 58,242 | 51,635 | -6,607 | -11.3% |
| 41 | Pennsylvania | 90,472 | 81,373 | -9,099 | -10.1% |
| 42 | Massachusetts | 62,555 | 56,744 | -5,811 | -9.3% |
| 43 | Connecticut | 28,909 | 26,902 | -2,007 | -6.9% |
| 44 | New Hampshire | 12,536 | 11,751 | -785 | -6.3% |
| 45 | North Carolina | 126,127 | 125,794 | -333 | -0.3% |
| 46 | Florida | 722,759 | 725,149 | 2,390 | 0.3% |
| 47 | District of Columbia | 3,432 | 3,522 | 90 | 2.6% |
| 48 | Texas | 708,067 | 764,316 | 56,249 | 7.9% |
| 49 | New Mexico | 11,197 | 12,863 | 1,666 | 14.9% |
| 50 | Mississippi | 48,089 | 62,394 | 14,305 | 29.7% |
| 51 | Rhode Island | 7,414 | 9,818 | 2,404 | 32.4% |
Source: ValuePenguin analysis of CMS Marketplace Open Enrollment Period Public Use Files from the 2025 and 2026 periods. Note: New plan selections are those who selected an exchange plan during open enrollment and weren’t counted as re-enrollees in the CMS data.
Bronze plans now make up nearly 40% of all selections
Bronze-tier plans — which generally have the lowest monthly cost but have higher deductibles and require consumers to pay about 40% of covered healthcare costs while the insurer pays about 60% — accounted for 39.6% of all marketplace plan selections nationwide in 2026.
In many states, Bronze plans account for over half of all marketplace plan selections, with Nebraska (65.9%), Montana (64.6%) and South Carolina (64.2%) seeing the largest share of Bronze selections.
Deventer says that the nature of Bronze plans carries risks, but they’re certainly better than being uninsured.
"Bronze plans tend to be cheaper than Silver or Gold plans because they require enrollees to pay a higher share of their own medical bills," she says. "That said, having a Bronze plan is still much better than having no insurance at all. The shift toward lower-tier plans such as Bronze indicates that people may be sacrificing coverage for a cheaper monthly rate, and gambling on the hope that they won’t have any major medical issues during the year that will require them to pay a large portion of their bills out of pocket."
Meanwhile, New Mexico (3.1%) and Massachusetts (8.4%) are the only states with a single-digit percentage of enrollees selecting Bronze plans.
Full rankings: States where ACA marketplace shoppers most/least commonly chose Bronze plans
Rank | State | Bronze plan selections, 2026 | Plan selections, 2026 | Bronze % share |
|---|---|---|---|---|
| 1 | Nebraska | 84,672 | 128,492 | 65.9% |
| 2 | Montana | 47,311 | 73,255 | 64.6% |
| 3 | South Carolina | 377,450 | 587,567 | 64.2% |
| 4 | North Carolina | 486,199 | 761,457 | 63.9% |
| 5 | Ohio | 282,120 | 469,616 | 60.1% |
| 6 | South Dakota | 30,223 | 50,951 | 59.3% |
| 6 | Wisconsin | 172,872 | 291,336 | 59.3% |
| 8 | Idaho | 70,540 | 120,426 | 58.6% |
| 9 | Oklahoma | 152,229 | 261,887 | 58.1% |
| 10 | Maine | 33,814 | 58,523 | 57.8% |
| 11 | Louisiana | 168,905 | 296,648 | 56.9% |
| 12 | Tennessee | 319,290 | 569,310 | 56.1% |
| 12 | Arizona | 200,376 | 357,144 | 56.1% |
| 14 | Minnesota | 77,802 | 139,251 | 55.9% |
| 15 | Oregon | 65,978 | 118,372 | 55.7% |
| 16 | North Dakota | 21,451 | 41,014 | 52.3% |
| 17 | Utah | 200,835 | 387,336 | 51.9% |
| 18 | Missouri | 187,274 | 365,734 | 51.2% |
| 19 | New York | 104,370 | 210,704 | 49.5% |
| 20 | Michigan | 239,037 | 497,064 | 48.1% |
| 21 | Iowa | 59,093 | 123,304 | 47.9% |
| 22 | Alaska | 12,441 | 26,079 | 47.7% |
| 23 | Kansas | 90,801 | 192,811 | 47.1% |
| 24 | Delaware | 20,891 | 44,663 | 46.8% |
| 25 | New Hampshire | 30,105 | 66,024 | 45.6% |
| 26 | Alabama | 198,749 | 455,776 | 43.6% |
| 27 | Nevada | 44,202 | 104,286 | 42.4% |
| 28 | Virginia | 156,700 | 370,086 | 42.3% |
| 29 | Hawaii | 9,317 | 23,380 | 39.9% |
| 30 | Kentucky | 35,330 | 89,028 | 39.7% |
| 31 | Georgia | 512,136 | 1,324,295 | 38.7% |
| 32 | Colorado | 106,571 | 277,238 | 38.4% |
| 32 | West Virginia | 21,474 | 55,879 | 38.4% |
| 34 | Illinois | 167,455 | 448,568 | 37.3% |
| 35 | Florida | 1,677,199 | 4,538,772 | 37.0% |
| 36 | Mississippi | 113,435 | 313,392 | 36.2% |
| 37 | Indiana | 107,691 | 300,049 | 35.9% |
| 38 | Wyoming | 14,824 | 41,545 | 35.7% |
| 39 | Vermont | 10,615 | 30,344 | 35.0% |
| 40 | District of Columbia | 5,263 | 16,053 | 32.8% |
| 41 | Arkansas | 52,071 | 160,307 | 32.5% |
| 42 | Texas | 1,299,290 | 4,172,233 | 31.1% |
| 43 | Rhode Island | 13,386 | 43,446 | 30.8% |
| 44 | Pennsylvania | 151,590 | 501,459 | 30.2% |
| 45 | Washington | 86,954 | 290,109 | 30.0% |
| 46 | California | 564,476 | 1,927,371 | 29.3% |
| 47 | Maryland | 67,563 | 255,612 | 26.4% |
| 48 | New Jersey | 124,678 | 509,192 | 24.5% |
| 49 | Connecticut | 38,213 | 156,745 | 24.4% |
| 50 | Massachusetts | 34,062 | 403,624 | 8.4% |
| 51 | New Mexico | 2,596 | 83,103 | 3.1% |
Source: ValuePenguin analysis of CMS Marketplace Open Enrollment Period Public Use Files from the 2026 period. Note: The Bronze share is calculated as Bronze plan selections divided by total exchange plan selections.
Vast majority of ACA enrollees are leaning on financial assistance
Federal assistance is a crucial part of the ACA marketplace, as 86.7% of consumers who selected a plan in 2026 received financial assistance through advance premium tax credits, cost-sharing reductions or both.
That reliance is even higher in some states. Mississippi topped the list at 95.4%, followed by Florida at 94.7% and Texas at 93.0%. Notably, nine of the top 10 states are in the South, with Utah being the only exception at No. 7.
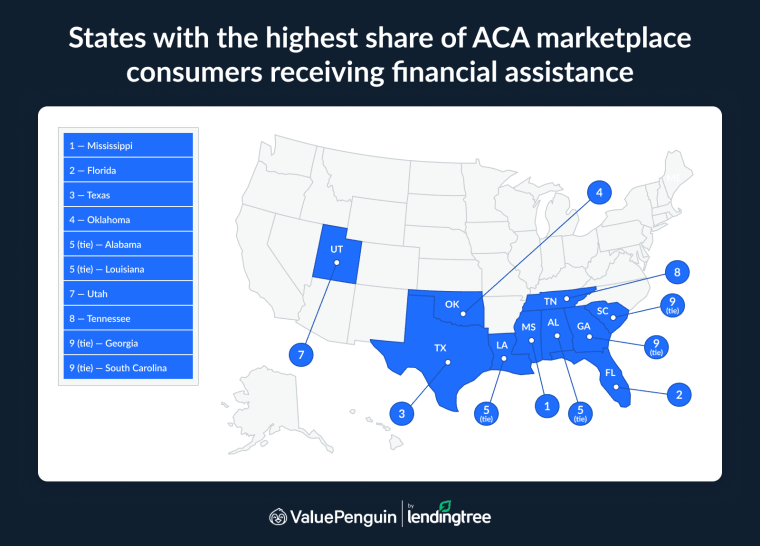
After the advance premium tax credit (which is separate from the expiring enhanced premium tax credit), the average monthly premium in the U.S. is $178. Two of the states with the highest financial assistance rates rank at the top again for having the lowest premiums after the advance premium tax credit. Texas has the lowest premium at $89, followed by Florida ($106) and Utah ($120).
Deventer says these figures paint a clear picture of how crucial financial assistance is for the ACA marketplace.
"Most consumers don’t pay the full, unsubsidized price for health insurance, which means the subsidies are integral to how the marketplace functions," she says. "The 2026 enrollment numbers show just how sensitive the marketplace is to changes in financial assistance. Consumers should always shop and check what their actual premium and healthcare costs will be after any subsidies that they qualify for. You may end up paying much less than you anticipate, even considering that prices have gone up."
On the other end of the list, the District of Columbia (18.8%) and New York (43.1%) have the lowest financial assistance rates. They’re also the states with the highest average monthly premiums after the advance premium tax credit, at $725 and $636, respectively.
Full rankings: States with the highest/lowest share of ACA marketplace consumers receiving financial assistance
Rank | State | Consumers receiving financial assistance | Plan selections, 2026 | % receiving financial assistance | Avg. monthly premium after advance premium tax credit |
|---|---|---|---|---|---|
| 1 | Mississippi | 299,069 | 313,392 | 95.4% | $131 |
| 2 | Florida | 4,298,085 | 4,538,772 | 94.7% | $106 |
| 3 | Texas | 3,879,651 | 4,172,233 | 93.0% | $89 |
| 4 | Oklahoma | 240,197 | 261,887 | 91.7% | $161 |
| 5 | Alabama | 415,568 | 455,776 | 91.2% | $126 |
| 5 | Louisiana | 270,603 | 296,648 | 91.2% | $144 |
| 7 | Utah | 351,583 | 387,336 | 90.8% | $120 |
| 8 | Tennessee | 514,745 | 569,310 | 90.4% | $141 |
| 9 | Georgia | 1,181,762 | 1,324,295 | 89.2% | $164 |
| 9 | South Carolina | 524,348 | 587,567 | 89.2% | $139 |
| 11 | West Virginia | 49,683 | 55,879 | 88.9% | $208 |
| 12 | Kansas | 171,263 | 192,811 | 88.8% | $160 |
| 13 | Wyoming | 36,267 | 41,545 | 87.3% | $235 |
| 14 | North Carolina | 663,536 | 761,457 | 87.1% | $180 |
| 14 | Arkansas | 139,608 | 160,307 | 87.1% | $162 |
| 16 | Missouri | 316,770 | 365,734 | 86.6% | $173 |
| 16 | Nebraska | 111,290 | 128,492 | 86.6% | $217 |
| 18 | Illinois | 382,499 | 448,568 | 85.3% | $230 |
| 19 | South Dakota | 42,712 | 50,951 | 83.8% | $211 |
| 20 | Indiana | 250,880 | 300,049 | 83.6% | $222 |
| 21 | New Mexico | 69,236 | 83,103 | 83.3% | $299 |
| 22 | Arizona | 296,237 | 357,144 | 82.9% | $229 |
| 23 | Nevada | 86,312 | 104,286 | 82.8% | $234 |
| 24 | Ohio | 388,261 | 469,616 | 82.7% | $233 |
| 25 | Rhode Island | 35,721 | 43,446 | 82.2% | $246 |
| 25 | New Jersey | 418,804 | 509,192 | 82.2% | $277 |
| 27 | California | 1,578,342 | 1,927,371 | 81.9% | $264 |
| 28 | Kentucky | 72,810 | 89,028 | 81.8% | $288 |
| 29 | Michigan | 404,240 | 497,064 | 81.3% | $222 |
| 30 | Delaware | 36,058 | 44,663 | 80.7% | $320 |
| 31 | Pennsylvania | 400,198 | 501,459 | 79.8% | $251 |
| 32 | Connecticut | 123,907 | 156,745 | 79.1% | $277 |
| 33 | North Dakota | 32,330 | 41,014 | 78.8% | $229 |
| 34 | Wisconsin | 228,595 | 291,336 | 78.5% | $250 |
| 35 | Montana | 57,435 | 73,255 | 78.4% | $230 |
| 36 | Virginia | 289,066 | 370,086 | 78.1% | $215 |
| 37 | Vermont | 23,343 | 30,344 | 76.9% | $364 |
| 38 | Idaho | 92,256 | 120,426 | 76.6% | $202 |
| 39 | Iowa | 93,994 | 123,304 | 76.2% | $235 |
| 40 | Alaska | 19,835 | 26,079 | 76.1% | $344 |
| 41 | Maine | 43,623 | 58,523 | 74.5% | $340 |
| 42 | Massachusetts | 292,919 | 403,624 | 72.6% | $325 |
| 43 | Hawaii | 16,757 | 23,380 | 71.7% | $372 |
| 44 | Colorado | 192,067 | 277,238 | 69.3% | $318 |
| 45 | Maryland | 172,940 | 255,612 | 67.7% | $284 |
| 46 | Washington | 187,588 | 290,109 | 64.7% | $343 |
| 47 | Oregon | 71,461 | 118,372 | 60.4% | $426 |
| 48 | New Hampshire | 37,029 | 66,024 | 56.1% | $342 |
| 49 | Minnesota | 69,397 | 139,251 | 49.8% | $437 |
| 50 | New York | 90,807 | 210,704 | 43.1% | $636 |
| 51 | District of Columbia | 3,017 | 16,053 | 18.8% | $725 |
Source: ValuePenguin analysis of CMS Marketplace Open Enrollment Period Public Use Files from the 2026 period. Notes: Financial assistance includes advance premium tax credits and/or cost-sharing reductions. The share receiving financial assistance is calculated as plan selections with advance premium tax credits and/or cost-sharing reductions divided by total exchange plan selections.
How to choose affordable health insurance without sacrificing coverage
Health insurance premiums can take a sizable bite out of a household budget, but choosing a plan based on the monthly price alone can leave individuals and families facing much larger bills when they need care. As you compare plans, consider both what you’ll pay each month and what the coverage could cost you when you use it. We offer the following advice:
- Look beyond the monthly premium. A low premium doesn’t necessarily mean a plan will cost less overall. "When shopping for a plan, compare the monthly prices, copay and coinsurance amounts, deductibles and out-of-pocket maximums," Deventer says. "Consider how much routine care might cost under each plan, as well as how much you could afford to pay in a year when you need significant medical treatment."
- Make sure the plan covers the care you need. Price isn’t the only consideration. "It’s also very important to consider a plan’s network and covered list of medications, called a formulary, as you shop, so that you end up with a plan that works for your specific medical needs," Deventer says. Check whether your preferred doctors, hospitals and specialists are in network and whether medications you regularly take are covered — and at what cost.
- Don’t automatically choose Bronze because it has a lower premium. Bronze plans generally offer lower monthly premiums in exchange for higher costs when you receive care. "Although Bronze plans may have a cheaper monthly rate, it’s still worth it for most people to consider a Silver plan, especially because Silver plans have extra discounts called cost-sharing reductions that lower the cost for medical care if you qualify,"
Methodology
ValuePenguin researchers analyzed the Centers for Medicare & Medicaid Services (CMS) Marketplace Open Enrollment Period Public Use Files for the 2025 and 2026 open enrollment periods. The plan selection and premium figures cover all metal tiers. The analysis includes the 50 states and the District of Columbia where available.
Plan selection changes were calculated by comparing total exchange plan selections during the 2025 and 2026 open enrollment periods. These figures reflect plan selections made during open enrollment, not effectuated coverage. New consumers are those who selected an exchange plan during the 2026 open enrollment period and weren’t classified as re-enrollees in the CMS data.
Premium comparisons use average monthly premiums before advance premium tax credits. Bronze shares were calculated by dividing Bronze plan selections by total exchange plan selections during the 2026 open enrollment period.
Financial assistance includes advance premium tax credits and/or cost-sharing reductions. The share receiving assistance was calculated by dividing consumers receiving either form of assistance by total exchange plan selections during the 2026 open enrollment period.
About the Author

Senior Writer, Consumer Research
Maggie Gunara is a senior staff writer at ValuePenguin. She primarily focuses on breaking down complex data and research about the financial lives of Americans into digestible content through our studies and surveys. Her reporting has been featured in numerous publications, such as Forbes and USA Today.
Education
- BA, Journalism, Pepperdine University
Editorial note: The content of this article is based on the author's opinions and recommendations alone. It has not been previewed, commissioned or otherwise endorsed by any of our network partners.
