
Medicare Ambulance Spending Rose 0.9% to $4.04 Billion in 2024

From 2015 to 2024, ambulance spending for Medicare beneficiaries fell sharply, despite a slight increase in 2024. However, per-user costs have skyrocketed: While overall expenditures fell by 13.1% during those 10 years, per-user spending jumped by 15.1% over the same period.
This study examines how ambulance expenditures have changed — and where they’ve changed the most. Here’s what we found.
Who is a typical Medicare beneficiary?
While the demographic breakdown of beneficiaries varies by year, most beneficiaries included in this study were 65 and older. Still, around 10% to 16% were younger than 65 depending on the year analyzed.
To better understand how age affected spending, 87.4% of ambulance expenses in 2024 were for beneficiaries 65 and older, while those younger than 65 accounted for 12.6%.
On this page
- Key findings
- Ambulance spending for Medicare beneficiaries rose slightly in 2024
- Between 2015 and 2024, ambulance spending increased the most in Alaska
- During that same period, ambulance spending declined in 36 states
- Wyoming had the highest per-user ambulance spending in 2024 and the largest increase from 2015 to 2024
- By county, average annual ambulance expenditures were highest in Los Angeles County
- Tips for Medicare beneficiaries facing ambulance costs
- Methodology
Key findings
- Ambulance spending for Medicare beneficiaries totaled $4.04 billion in 2024, an increase of 0.9% from 2023. Despite that year-over-year increase, overall spending was 13.1% lower in 2024 than in 2015, when it totaled $4.65 billion. However, per-user spending increased 15.1% from $996 in 2015 to $1,146 in 2024.
- Between 2015 and 2024, ambulance spending increased the most in Alaska. Spending for Medicare beneficiaries in Alaska rose 63.8%, from $14.0 million in 2015 to $23.0 million in 2024. Wyoming followed at 36.7%, while Minnesota ranked third with an increase of 29.9%.
- During that same period, ambulance spending declined in 36 states. West Virginia saw the largest drop, with spending falling 46.5% from 2015 to 2024. Indiana followed at 44.5%, while Rhode Island had the third-largest decrease at 42.4%. Three other states had decreases of at least 40.0%.
- Wyoming recorded the highest per-user ambulance costs in 2024 and the largest increase in per-user ambulance spending from 2015 to 2024. Per-user costs rose 58.0%, from $1,325 in 2015 to $2,094 in 2024. New Jersey followed at 43.4%, while Montana ranked third at 35.1%. Only seven states saw per-user spending decrease during that period, led by Indiana with a decline of 10.2%.
- By county, average annual ambulance expenditures were highest in Los Angeles County. Between 2015 and 2024, average annual ambulance spending for Medicare beneficiaries in Los Angeles County was $70.6 million. Spending there fell 29.8% over that period, though 10 of the 50 counties with the highest average annual spending saw increases.
Ambulance spending for Medicare beneficiaries rose slightly in 2024
Ambulance spending for Medicare beneficiaries totaled $4.04 billion in 2024, the latest year for which data is available. That’s an increase of 0.9% from 2023, marking the second straight yearly increase. (Spending rose 3.8% in 2023.)
Despite those recent year-over-year increases, overall spending was 13.1% lower in 2024 than in 2015, when it totaled $4.65 billion. Spending fell below $4.00 billion in 2021 and 2022 before rising in 2023 and 2024.
Annual ambulance spending for Medicare beneficiaries
Year | Spending | Year-over-year change (%) |
|---|---|---|
| 2015 | $4.65 billion | N/A |
| 2016 | $4.59 billion | -1.4% |
| 2017 | $4.61 billion | 0.6% |
| 2018 | $4.53 billion | -1.8% |
| 2019 | $4.47 billion | -1.3% |
| 2020 | $4.10 billion | -8.3% |
| 2021 | $3.95 billion | -3.7% |
| 2022 | $3.86 billion | -2.4% |
| 2023 | $4.00 billion | 3.8% |
| 2024 | $4.04 billion | 0.9% |
Source: ValuePenguin analysis of data from the Centers for Medicare & Medicaid Services (CMS) Medicare Geographic Variation Public Use File. Note: This displays actual rather than standardized costs.
One likely contributor was Medicare's Repetitive, Scheduled Non-Emergent Ambulance Transport (RSNAT) prior authorization model, which significantly reduced unnecessary scheduled ambulance transports and associated Medicare spending. According to a 2022 study published in the National Library of Medicine, the RSNAT model reduced expenditures for scheduled nonemergency ambulance transports by 77% between 2012 and 2019. That led to a 2.4% reduction in total Medicare expenditures per beneficiary year.
Another likely contributor is the continued growth of Medicare Advantage enrollment. As more beneficiaries enrolled in Medicare Advantage plans, fewer ambulance claims would appear in traditional Medicare fee-for-service data. KFF notes that traditional Medicare enrollment has declined as the share of beneficiaries choosing Medicare Advantage has grown. The COVID-19 pandemic also contributed to a broader decline in healthcare utilization among traditional Medicare beneficiaries in 2020, which may have further reduced ambulance use.
A closer look at per-user spending shows a different trend. Per-user ambulance spending for Medicare beneficiaries increased 15.1% from $996 in 2015 to $1,146 in 2024, including a 3.5% increase from 2023 to 2024. In sharp contrast to overall spending trends, per-user spending rose every year since 2015 except 2016 (down 1.7%) and 2021 (down 0.9%). That includes an 8.8% jump in 2023, the largest annual increase during the period we analyzed.
Annual per-user Medicare spending on ambulances
Year | Cost per user | Year-over-year change (%) |
|---|---|---|
| 2015 | $996 | N/A |
| 2016 | $979 | -1.7% |
| 2017 | $988 | 0.9% |
| 2018 | $993 | 0.5% |
| 2019 | $1,007 | 1.4% |
| 2020 | $1,023 | 1.6% |
| 2021 | $1,014 | -0.9% |
| 2022 | $1,017 | 0.3% |
| 2023 | $1,107 | 8.8% |
| 2024 | $1,146 | 3.5% |
Source: ValuePenguin analysis of data from the CMS Medicare Geographic Variation Public Use File. Note: This displays actual rather than standardized costs.
Rising per-user spending likely reflects a combination of higher reimbursement rates, inflation, wage pressures affecting EMS providers and a greater share of transports involving patients with more complex medical needs. Because fewer beneficiaries were using ambulance services overall while the remaining users may have required more intensive or longer-distance transports, average spending per user increased even as total expenditures declined.
Between 2015 and 2024, ambulance spending increased the most in Alaska
While ambulance spending for Medicare beneficiaries fell sharply from 2015 to 2024 nationally, 10 states saw double-digit spending growth during that period. By far, the sharpest growth was in Alaska, where spending rose 63.8%, from $14.0 million in 2015 to $23.0 million in 2024.
Alaska faces unique challenges in providing emergency medical services. These challenges — which include long transport distances, extreme geography and climate, limited road systems and a sparse population — can contribute to higher costs for ambulance services across the state.
In addition, Alaska’s population is rapidly aging. Between 2010 and 2025, the number of residents 60 and older increased by 78%, according to the Alaska Commission on Aging. That demographic shift may have increased demand for Medicare-covered ambulance services.
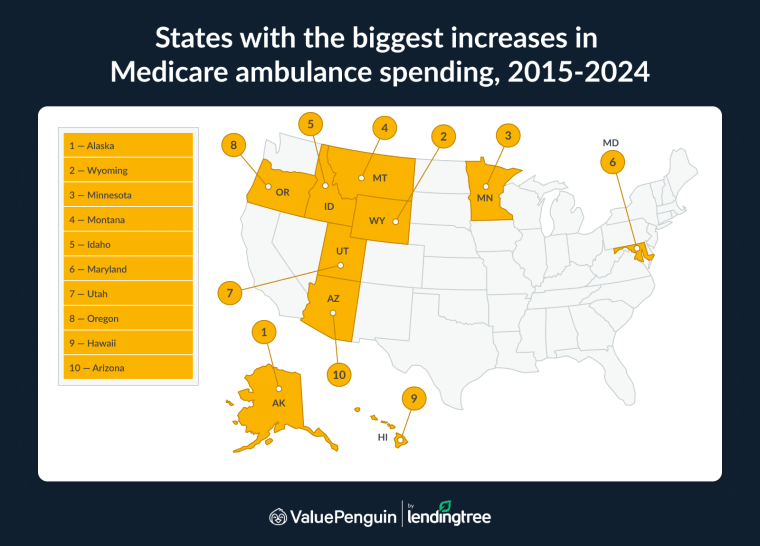
Wyoming followed at 36.7%, while Minnesota and Montana ranked third and fourth, with increases of 29.9% and 29.0%, respectively.
Like Alaska, Wyoming has a rural nature that could contribute to high costs. Despite having the smallest population in America, Wyoming is the 10th-largest state by land area — meaning emergency services may have to travel longer distances. In addition, ongoing EMS workforce shortages and recruitment challenges may increase operating costs for providers.
Further, Wyoming has one of the nation's most rapidly aging populations, increasing demand for Medicare-covered health services.
All but one of the states that saw double-digit increases were in the West or Midwest. Maryland, which ranked sixth with 18.6% growth from 2015 to 2024, was the lone exception.
During that same period, ambulance spending declined in 36 states
The large spending increases seen in Alaska and other states from 2015 to 2024 were the exception rather than the rule, however. During that period, 35 states and the District of Columbia saw spending fall, including six states with decreases of more than 40.0%.
West Virginia saw the largest drop, with spending falling 46.5% from 2015 to 2024. Indiana followed at 44.5%, while Rhode Island had the third-largest decrease at 42.4%. Three other states had decreases of at least 40.0%: Alabama, Michigan and Maine. Meanwhile, spending in seven other states fell by 30.0% to 40.0%.
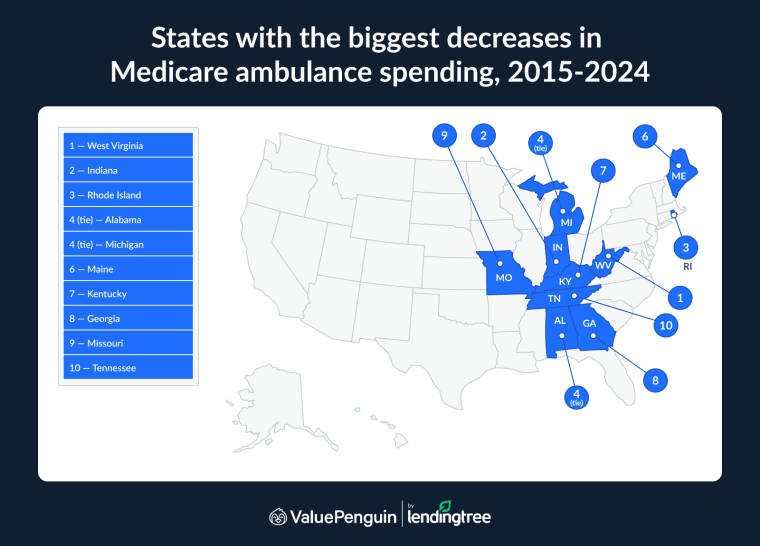
States with the biggest increases/decreases in ambulance spending
Rank | State | Annual cost, 2015 | Annual cost, 2024 | % change |
|---|---|---|---|---|
| 1 | Alaska | $14.0 million | $23.0 million | 63.8% |
| 2 | Wyoming | $8.5 million | $11.6 million | 36.7% |
| 3 | Minnesota | $28.6 million | $37.2 million | 29.9% |
| 4 | Montana | $12.9 million | $16.7 million | 29.0% |
| 5 | Idaho | $15.8 million | $18.8 million | 18.9% |
| 6 | Maryland | $82.4 million | $97.7 million | 18.6% |
| 7 | Utah | $13.5 million | $15.8 million | 17.1% |
| 8 | Oregon | $43.6 million | $50.5 million | 15.8% |
| 9 | Hawaii | $8.5 million | $9.8 million | 15.3% |
| 10 | Arizona | $69.0 million | $76.4 million | 10.8% |
| 11 | South Dakota | $11.3 million | $12.0 million | 6.0% |
| 12 | New Mexico | $33.5 million | $35.3 million | 5.1% |
| 13 | Washington | $81.0 million | $84.9 million | 4.8% |
| 14 | Nevada | $32.0 million | $33.4 million | 4.4% |
| 15 | Colorado | $38.1 million | $39.1 million | 2.4% |
| 16 | Kansas | $42.6 million | $42.3 million | -0.8% |
| 17 | North Dakota | $8.0 million | $7.8 million | -2.1% |
| 18 | New Jersey | $125.4 million | $122.4 million | -2.4% |
| 19 | Nebraska | $23.8 million | $23.2 million | -2.5% |
| 20 | Oklahoma | $71.1 million | $69.2 million | -2.8% |
| 21 | Vermont | $14.4 million | $13.9 million | -3.2% |
| 22 | California | $375.4 million | $359.4 million | -4.3% |
| 23 | Illinois | $201.2 million | $189.4 million | -5.9% |
| 24 | Iowa | $38.8 million | $35.8 million | -7.7% |
| 25 | Wisconsin | $63.0 million | $58.0 million | -8.0% |
| 26 | New York | $233.2 million | $213.2 million | -8.6% |
| 27 | Massachusetts | $175.3 million | $157.1 million | -10.4% |
| 27 | Florida | $279.5 million | $250.3 million | -10.4% |
| 29 | Delaware | $22.6 million | $20.0 million | -11.7% |
| 30 | Pennsylvania | $180.8 million | $157.5 million | -12.9% |
| 31 | Mississippi | $58.6 million | $50.9 million | -13.2% |
| 32 | New Hampshire | $27.3 million | $23.7 million | -13.4% |
| 33 | District of Columbia | $8.0 million | $6.6 million | -17.5% |
| 34 | Arkansas | $59.5 million | $48.7 million | -18.1% |
| 35 | Texas | $340.5 million | $270.3 million | -20.6% |
| 36 | Louisiana | $74.7 million | $56.8 million | -24.0% |
| 37 | Ohio | $201.0 million | $145.6 million | -27.6% |
| 37 | South Carolina | $135.2 million | $97.9 million | -27.6% |
| 39 | Virginia | $151.5 million | $105.7 million | -30.2% |
| 40 | North Carolina | $179.2 million | $122.7 million | -31.5% |
| 40 | Connecticut | $75.8 million | $51.9 million | -31.5% |
| 42 | Tennessee | $141.7 million | $96.6 million | -31.8% |
| 43 | Missouri | $97.9 million | $64.6 million | -34.0% |
| 44 | Georgia | $204.0 million | $131.7 million | -35.5% |
| 45 | Kentucky | $112.1 million | $68.9 million | -38.5% |
| 46 | Maine | $32.4 million | $19.2 million | -40.8% |
| 47 | Michigan | $164.9 million | $95.9 million | -41.8% |
| 47 | Alabama | $105.8 million | $61.6 million | -41.8% |
| 49 | Rhode Island | $25.5 million | $14.7 million | -42.4% |
| 50 | Indiana | $116.3 million | $64.6 million | -44.5% |
| 51 | West Virginia | $69.1 million | $36.9 million | -46.5% |
Source: ValuePenguin analysis of data from the CMS Medicare Geographic Variation Public Use File. Note: This displays standardized costs.
Wyoming had the highest per-user ambulance spending in 2024 and the largest increase from 2015 to 2024
While overall ambulance spending on Medicare beneficiaries fell sharply over the 10 years analyzed, per-user spending moved in the opposite direction. Nationally, per-user ambulance spending on Medicare beneficiaries reached $1,146 in 2024. That’s a 3.5% increase from 2023 and a 15.1% increase from 2015.
Wyoming had the highest per-user costs in 2024 ($2,094). Alaska was the only other state with per-user costs of $2,000 or more, at $2,025. New Mexico ($1,789), Georgia ($1,412) and West Virginia ($1,332) had the next highest per-user costs in 2024.
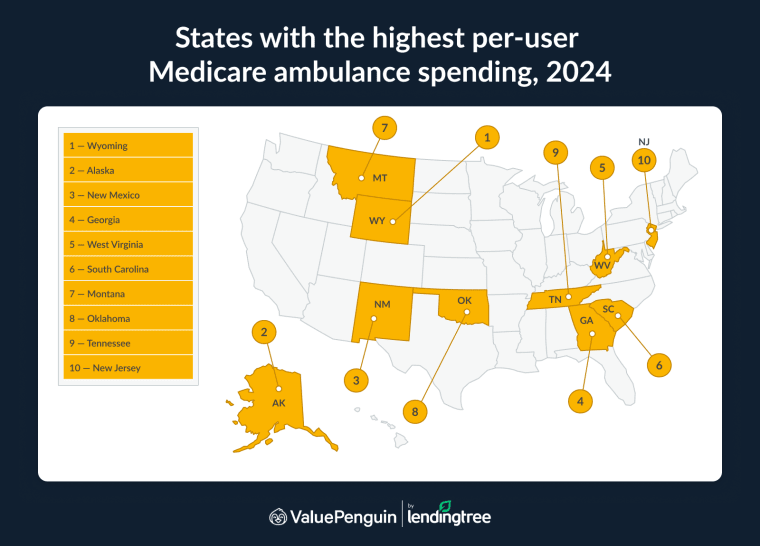
States with the highest per-user Medicare ambulance spending
Rank | State | Annual spending | Annual per-user spending | Ambulance events per 1,000 beneficiaries |
|---|---|---|---|---|
| 1 | Wyoming | $11.6 million | $2,094 | 109 |
| 2 | Alaska | $23.0 million | $2,025 | 261 |
| 3 | New Mexico | $35.3 million | $1,789 | 212 |
| 4 | Georgia | $131.7 million | $1,412 | 470 |
| 5 | West Virginia | $36.9 million | $1,332 | 461 |
| 6 | South Carolina | $97.9 million | $1,311 | 432 |
| 7 | Montana | $16.7 million | $1,276 | 147 |
| 8 | Oklahoma | $69.2 million | $1,273 | 300 |
| 9 | Tennessee | $96.6 million | $1,259 | 344 |
| 10 | New Jersey | $122.4 million | $1,256 | 385 |
| 11 | Kentucky | $68.9 million | $1,254 | 363 |
| 12 | Mississippi | $50.9 million | $1,231 | 316 |
| 13 | Oregon | $50.5 million | $1,219 | 234 |
| 14 | Louisiana | $56.8 million | $1,200 | 358 |
| 15 | Texas | $270.3 million | $1,187 | 337 |
| 16 | Nevada | $33.4 million | $1,180 | 250 |
| 17 | Illinois | $189.4 million | $1,179 | 363 |
| 18 | South Dakota | $12.0 million | $1,172 | 168 |
| 19 | Alabama | $61.6 million | $1,169 | 370 |
| 20 | Massachusetts | $157.1 million | $1,166 | 478 |
| 21 | Connecticut | $51.9 million | $1,162 | 513 |
| 22 | Arizona | $76.4 million | $1,141 | 192 |
| 23 | Rhode Island | $14.7 million | $1,139 | 489 |
| 24 | Idaho | $18.8 million | $1,135 | 163 |
| 25 | Arkansas | $48.7 million | $1,123 | 294 |
| 26 | Kansas | $42.3 million | $1,110 | 202 |
| 27 | Washington | $84.9 million | $1,097 | 246 |
| 28 | California | $359.4 million | $1,093 | 290 |
| 29 | Ohio | $145.6 million | $1,081 | 360 |
| 30 | North Carolina | $122.7 million | $1,067 | 336 |
| 31 | Hawaii | $9.8 million | $1,064 | 162 |
| 32 | Nebraska | $23.2 million | $1,054 | 186 |
| 33 | Missouri | $64.6 million | $1,046 | 248 |
| 34 | Maine | $19.2 million | $1,026 | 302 |
| 34 | Pennsylvania | $157.5 million | $1,026 | 316 |
| 36 | Wisconsin | $58.0 million | $1,016 | 261 |
| 37 | Iowa | $35.8 million | $1,006 | 164 |
| 37 | New York | $213.2 million | $1,006 | 351 |
| 37 | Colorado | $39.1 million | $1,006 | 197 |
| 40 | Vermont | $13.9 million | $1,005 | 324 |
| 40 | Michigan | $95.9 million | $1,005 | 311 |
| 42 | Maryland | $97.7 million | $1,000 | 319 |
| 43 | Virginia | $105.7 million | $998 | 278 |
| 44 | Indiana | $64.6 million | $973 | 245 |
| 45 | District of Columbia | $6.6 million | $971 | 337 |
| 45 | Utah | $15.8 million | $971 | 158 |
| 47 | Minnesota | $37.2 million | $964 | 198 |
| 47 | North Dakota | $7.8 million | $964 | 167 |
| 49 | Florida | $250.3 million | $958 | 287 |
| 50 | New Hampshire | $23.7 million | $953 | 286 |
| 51 | Delaware | $20.0 million | $942 | 319 |
Source: ValuePenguin analysis of 2024 data from the CMS Medicare Geographic Variation Public Use File. Note: This displays standardized costs.
Wyoming also had the largest 10-year increase in per-user costs, up 58.0% from $1,325 in 2015 to $2,094 in 2024. New Jersey followed at 43.4%, while Montana (35.1%), New Mexico (32.3%), Utah (30.6%) and Washington (30.0%) all saw growth of at least 30.0%.
Just seven states saw per-user spending decrease from 2015 to 2024. Indiana (down 10.2%) was the only state to see a double-digit decrease, though Virginia (down 9.6%) and South Carolina (down 8.5%) weren’t far behind.
States with the biggest increases/decreases in per-user Medicare ambulance spending
Rank | State | Annual per-user spending, 2015 | Annual per-user spending, 2024 | % change |
|---|---|---|---|---|
| 1 | Wyoming | $1,325 | $2,094 | 58.0% |
| 2 | New Jersey | $876 | $1,256 | 43.4% |
| 3 | Montana | $944 | $1,276 | 35.1% |
| 4 | New Mexico | $1,352 | $1,789 | 32.3% |
| 5 | Utah | $743 | $971 | 30.6% |
| 6 | Washington | $844 | $1,097 | 30.0% |
| 7 | Oregon | $950 | $1,219 | 28.4% |
| 8 | Idaho | $889 | $1,135 | 27.8% |
| 9 | Wisconsin | $798 | $1,016 | 27.4% |
| 10 | Nebraska | $837 | $1,054 | 25.8% |
| 11 | Oklahoma | $1,016 | $1,273 | 25.3% |
| 12 | District of Columbia | $783 | $971 | 24.0% |
| 13 | Nevada | $954 | $1,180 | 23.8% |
| 14 | Iowa | $816 | $1,006 | 23.3% |
| 15 | Maryland | $812 | $1,000 | 23.2% |
| 16 | Kansas | $904 | $1,110 | 22.8% |
| 17 | South Dakota | $960 | $1,172 | 22.1% |
| 18 | Illinois | $967 | $1,179 | 21.9% |
| 19 | Minnesota | $795 | $964 | 21.3% |
| 20 | Hawaii | $886 | $1,064 | 20.1% |
| 21 | Connecticut | $970 | $1,162 | 19.7% |
| 22 | Louisiana | $1,004 | $1,200 | 19.5% |
| 23 | Pennsylvania | $868 | $1,026 | 18.2% |
| 24 | Alaska | $1,727 | $2,025 | 17.2% |
| 25 | Arizona | $974 | $1,141 | 17.1% |
| 26 | Colorado | $861 | $1,006 | 16.8% |
| 26 | Vermont | $860 | $1,005 | 16.8% |
| 28 | Mississippi | $1,079 | $1,231 | 14.1% |
| 29 | Florida | $843 | $958 | 13.7% |
| 30 | Arkansas | $1,005 | $1,123 | 11.8% |
| 31 | New Hampshire | $858 | $953 | 11.1% |
| 32 | New York | $923 | $1,006 | 9.1% |
| 33 | Alabama | $1,084 | $1,169 | 7.9% |
| 33 | Massachusetts | $1,081 | $1,166 | 7.9% |
| 35 | Missouri | $971 | $1,046 | 7.7% |
| 35 | Kentucky | $1,165 | $1,254 | 7.7% |
| 37 | California | $1,021 | $1,093 | 7.0% |
| 38 | North Carolina | $999 | $1,067 | 6.8% |
| 39 | Michigan | $949 | $1,005 | 5.8% |
| 40 | Texas | $1,140 | $1,187 | 4.1% |
| 41 | North Dakota | $939 | $964 | 2.7% |
| 42 | Ohio | $1,059 | $1,081 | 2.1% |
| 43 | Maine | $1,006 | $1,026 | 2.0% |
| 44 | Rhode Island | $1,123 | $1,139 | 1.4% |
| 45 | Delaware | $964 | $942 | -2.3% |
| 46 | Tennessee | $1,293 | $1,259 | -2.6% |
| 47 | Georgia | $1,503 | $1,412 | -6.0% |
| 48 | West Virginia | $1,428 | $1,332 | -6.7% |
| 49 | South Carolina | $1,433 | $1,311 | -8.5% |
| 50 | Virginia | $1,104 | $998 | -9.6% |
| 51 | Indiana | $1,083 | $973 | -10.2% |
Source: ValuePenguin analysis of data from the CMS Medicare Geographic Variation Public Use File. Note: This displays standardized costs.
By county, average annual ambulance expenditures were highest in Los Angeles County
We also reviewed ambulance spending for Medicare beneficiaries from 2015 to 2024 at the county level and found that, perhaps unsurprisingly, the counties that spent the most were among the nation’s most populous.
During that period, the highest average annual ambulance spending for Medicare beneficiaries was in California’s Los Angeles County ($70.6 million), followed closely by Illinois’ Cook County ($66.4 million), which is in the Chicago metro area. Those two counties were by far the highest we reviewed, though Harris County, Texas (Houston metro), and Kings County, N.Y. (New York City metro), were next on the list at $42.3 million and $31.1 million, respectively.
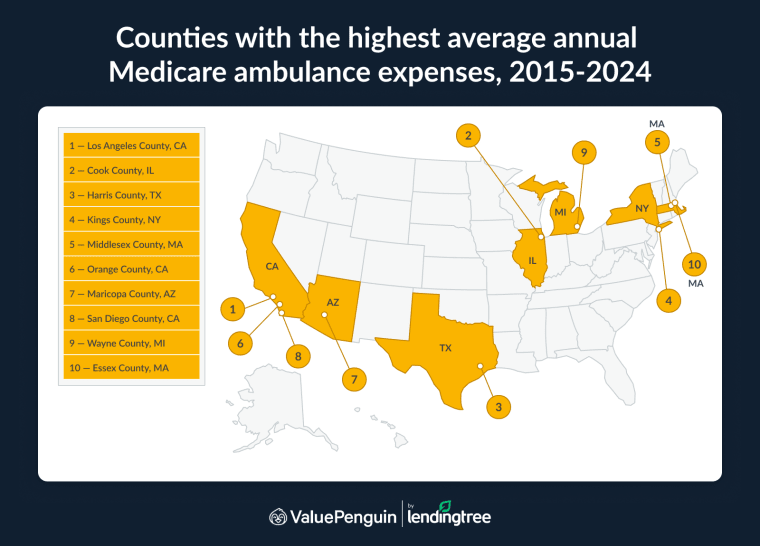
Among the 10 highest spending counties, just two — Maricopa, Ariz. (Phoenix metro), and Wayne, Mich. (Detroit metro) — saw their spending increase from 2015 to 2024. Spending in Maricopa County rose 28.8%, while spending in Wayne County rose 11.5%.
Counties with the highest average annual ambulance expenditures
Rank | County | Avg. annual expenses, 2015-2024 | % change in expenses, 2015-2024 |
|---|---|---|---|
| 1 | Los Angeles, CA | $70.6 million | -29.8% |
| 2 | Cook, IL | $66.4 million | -16.2% |
| 3 | Harris, TX | $42.3 million | -36.1% |
| 4 | Kings, NY | $31.1 million | -29.2% |
| 5 | Middlesex, MA | $27.8 million | -8.6% |
| 6 | Orange, CA | $26.9 million | -2.1% |
| 7 | Maricopa, AZ | $24.8 million | 28.8% |
| 8 | San Diego, CA | $22.9 million | -50.5% |
| 9 | Wayne, MI | $21.8 million | 11.5% |
| 10 | Essex, MA | $20.9 million | -13.0% |
| 11 | Dallas, TX | $19.7 million | -38.6% |
| 12 | Bristol, MA | $19.4 million | -30.8% |
| 13 | Suffolk, NY | $19.0 million | -13.6% |
| 14 | Queens, NY | $18.5 million | -16.3% |
| 15 | Norfolk, MA | $17.8 million | -23.4% |
| 16 | Nassau, NY | $17.3 million | -2.9% |
| 17 | Oakland, MI | $16.7 million | -3.7% |
| 18 | Clark, NV | $16.4 million | -19.1% |
| 19 | Philadelphia, PA | $16.2 million | -18.7% |
| 20 | Plymouth, MA | $15.9 million | -30.7% |
| 21 | Palm Beach, FL | $15.7 million | 90.3% |
| 22 | Shelby, TN | $15.6 million | -44.0% |
| 23 | Worcester, MA | $15.5 million | -15.0% |
| 24 | Suffolk, MA | $15.2 million | -2.0% |
| 25 | Pinellas, FL | $15.1 million | -45.1% |
| 26 | Baltimore, MD | $14.5 million | 21.1% |
| 26 | Alameda, CA | $14.5 million | 20.6% |
| 28 | Fulton, GA | $14.4 million | -16.6% |
| 29 | Westchester, NY | $14.2 million | -5.6% |
| 30 | King, WA | $14.1 million | 69.6% |
| 30 | San Bernardino, CA | $14.1 million | 3.3% |
| 32 | Riverside, CA | $14.0 million | -43.5% |
| 33 | Sacramento, CA | $13.6 million | -31.4% |
| 33 | Tarrant, TX | $13.6 million | -23.3% |
| 35 | Miami-Dade, FL | $13.2 million | -47.7% |
| 36 | Montgomery, MD | $13.1 million | 1.8% |
| 37 | Santa Clara, CA | $12.9 million | -13.8% |
| 38 | Montgomery, PA | $12.6 million | 2.4% |
| 38 | Ocean, NJ | $12.6 million | -18.6% |
| 40 | DeKalb, GA | $12.4 million | -4.1% |
| 41 | Broward, FL | $12.1 million | -31.9% |
| 42 | Bexar, TX | $12.0 million | -45.8% |
| 43 | Franklin, OH | $11.9 million | -7.7% |
| 44 | Barnstable, MA | $11.7 million | -12.2% |
| 45 | Essex, NJ | $11.3 million | -23.8% |
| 46 | DuPage, IL | $11.2 million | 16.7% |
| 47 | Cuyahoga, OH | $10.2 million | -60.9% |
| 48 | Hampden, MA | $9.8 million | -40.3% |
| 49 | Hillsborough, FL | $9.5 million | -55.9% |
| 50 | New York, NY | $8.6 million | -67.6% |
Source: ValuePenguin analysis of data from the CMS Medicare Geographic Variation Public Use File. Note: This displays standardized costs.
The list of counties with the biggest percentage increases and decreases in per-user costs from 2015 to 2024 looks quite different from the list of counties with the highest average annual spending. That shouldn’t be surprising because when a county’s spending is relatively low, it takes less movement to produce a large percentage change. For example, a $50 decrease is a big deal when the previous amount was $200, but it’s less so when it was $2,000.
Still, the percentage changes were staggering in many counties. Sheridan County, Mont., led the way with a 469.0% jump, while Rock County, Neb. (314.4%), and Daniels County, Mont. (307.0%), both saw increases of at least 300.0%. Ten other counties, including two more each in Montana and Nebraska, saw per-user costs jump more than 200.0%.
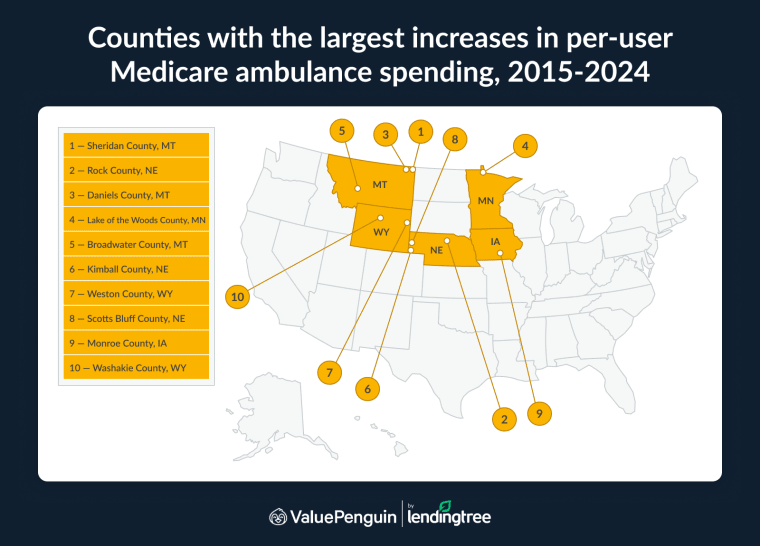
20 counties with the highest jumps in per-user costs
Rank | County | % change in per-user costs, 2015-2024 |
|---|---|---|
| 1 | Sheridan, MT | 469.0% |
| 2 | Rock, NE | 314.4% |
| 3 | Daniels, MT | 307.0% |
| 4 | Lake of the Woods, MN | 294.5% |
| 5 | Broadwater, MT | 293.6% |
| 6 | Kimball, NE | 267.5% |
| 7 | Weston, WY | 248.8% |
| 8 | Scotts Bluff, NE | 244.0% |
| 9 | Monroe, IA | 243.9% |
| 10 | Washakie, WY | 235.3% |
| 11 | Lucas, IA | 221.2% |
| 12 | Blaine, MT | 220.9% |
| 13 | Kearny, KS | 212.8% |
| 14 | Harding, NM | 199.4% |
| 15 | Prairie, MT | 197.9% |
| 16 | Duchesne, UT | 195.7% |
| 17 | Clay, GA | 179.5% |
| 18 | Big Horn, WY | 179.0% |
| 19 | Lincoln, NV | 175.5% |
| 20 | Franklin, NE | 172.2% |
Source: ValuePenguin analysis of data from the CMS Medicare Geographic Variation Public Use File. Note: This displays standardized costs.
On the flip side, per-user costs plunged by 85.9% from 2015 to 2024 in Traverse County, Minn., and 72.9% in Kinney County, Texas. Six other counties, including two more in Texas, saw costs drop between 60.0% and 70.0%.
20 counties with the biggest declines in per-user costs
Rank | County | % change in per-user costs, 2015-2024 |
|---|---|---|
| 1 | Traverse, MN | -85.9% |
| 2 | Kinney, TX | -72.9% |
| 3 | Habersham, GA | -69.8% |
| 4 | Val Verde, TX | -67.2% |
| 5 | Jim Hogg, TX | -66.7% |
| 6 | Camas, ID | -64.8% |
| 7 | Cedar, MO | -64.5% |
| 8 | Dubois, IN | -61.9% |
| 9 | Ochiltree, TX | -59.3% |
| 10 | Spalding, GA | -57.2% |
| 11 | Clinch, GA | -56.0% |
| 12 | Kent, TX | -55.8% |
| 13 | Chattooga, GA | -55.7% |
| 14 | Northampton, VA | -55.3% |
| 15 | Adams, ND | -54.8% |
| 16 | Coffey, KS | -52.8% |
| 17 | Daggett, UT | -52.0% |
| 18 | Union, MS | -51.9% |
| 19 | Crosby, TX | -51.2% |
| 20 | Nottoway, VA | -50.5% |
Source: ValuePenguin analysis of data from the CMS Medicare Geographic Variation Public Use File. Note: This displays standardized costs.
Tips for Medicare beneficiaries facing ambulance costs
You can’t always avoid an ambulance ride, but a little preparation can reduce the chances of a costly surprise.
- Know what Medicare covers. Medicare Part B generally covers medically necessary emergency ambulance transportation. Once you’ve met the deductible, you’ll typically owe 20% of the Medicare-approved amount. Medicare may also cover limited nonemergency ambulance transportation when specific requirements are met.
- If you believe your health or safety is at risk, call 911. The bill matters, but your immediate safety comes first. Worry about the bill once you’re safe.
- Don’t wait for an emergency to review your Medicare Advantage plan. Ambulance costs and coverage rules can vary by plan. Knowing your benefits before you need them can help you understand what you may owe.
- Check every bill and coverage statement. Compare the ambulance bill with your Medicare Summary Notice or Explanation of Benefits. If the numbers don’t match or something doesn’t look right, call the provider or your insurer and ask questions.
- Don’t be shy about asking for help. Contact the billing office if you can’t afford the amount due. Ask whether a payment plan or financial assistance is available. There’s no guarantee, but it never hurts to ask.
Methodology
ValuePenguin researchers analyzed ambulance spending using aggregate and standardized data from the Centers for Medicare & Medicaid Services (CMS) Medicare Geographic Variation Public Use File. The analysis used the 2026 data release, which includes data through 2024.
National spending and per-user spending tables use actual ambulance costs. State and county comparisons use standardized costs to enable cross-geographic comparisons. Standardized costs use standardized payment amounts rather than allowed amounts.
Researchers analyzed national, state and county ambulance spending from 2015 through 2024. State rankings include the District of Columbia. County tables rank counties by average annual spending, percentage change in total spending, percentage change in per-user spending and 2024 per-user spending.
About the Author

Chief Consumer Finance Analyst
Matt Schulz is Chief Consumer Finance Analyst at ValuePenguin and author of "Ask Questions, Save Money, Make More: How To Take Control Of Your Financial Life," which was published by Countryman Press in March 2024.
A credit and personal finance expert for more than 15 years, he has been quoted in or appeared on Good Morning America, NBC Nightly News, the Wall Street Journal, New York Times and hundreds of other media outlets around the U.S. and the world. He has had his work published in Business Insider, CBS MoneyWatch, American Banker, USNews.com and more.
Matt is not a banker or an economist. He is a husband and a dad. He is a former journalist who has run multiple newsrooms – and he is a guy who had $10,000 in credit card debt and a monthly payment on a brand new car in his 20s, primarily because of his own bad choices. Now, he is on a mission to help people make better decisions than he made and to wield the power they have over their own money.
He is a graduate of the University of Texas at Austin, where he lives today.
Expertise
- Credit cards and debit cards
- Buy now, pay later (BNPL)
- Credit reporting and scoring
- Auto loans
- Personal loans
- Mortgages
- Consumer debt
Credentials
- Author, “Ask Questions, Save Money, Make More: How To Take Control Of Your Financial Life"
- Residential Mortgage Lender Certificate, American Bankers Association
Referenced by
- CBS Evening News
- Good Morning America
- New York Times
- Wall Street Journal
Education
- Bachelor of Journalism, University of Texas at Austin
Editorial note: The content of this article is based on the author's opinions and recommendations alone. It has not been previewed, commissioned or otherwise endorsed by any of our network partners.
