STD Rates Decline Nationally, With Sharp State-by-State Differences

Rates for the most commonly reported bacterial sexually transmitted disease (STD) fell nationally between 2020 and 2024, according to a ValuePenguin analysis of Centers for Disease Control and Prevention (CDC) data. Chlamydia, the most commonly reported bacterial STD, declined 6.5% over that period, while gonorrhea fell 21.9%.
National averages don’t tell the full story, though. STD rates still vary sharply by state, and a handful of states saw overall rates increase between 2019 and 2023, even as rates in many other states declined. This ValuePenguin study looks at both national and state trends, then discusses how health coverage and access to health care may help connect the dots.
On this page
- Key findings
- Most commonly reported bacterial STD saw rates decline
- 5 states saw overall STD rates rise between 2019, 2023
- 11 states experienced increase in overall STD rates between 2022, 2023
- Louisiana had highest combined STD rate in 2023
- STD screenings, treatments and health insurance: 4 things to know
- Methodology
Key findings
- Rates for the most commonly reported bacterial STD dropped nationally between 2020 and 2024, according to Centers for Disease Control and Prevention (CDC) data. Chlamydia rates per 100,000 residents fell by 6.5%. Gonorrhea saw the biggest decline during this period, falling 21.9%.
- Only five states saw overall STD rates rise between 2019 and 2023. South Dakota (11.9%), Texas (11.7%) and Georgia (9.1%) led these increases when combining gonorrhea, primary and secondary syphilis, and chlamydia. In contrast, Montana (30.8%), Idaho (29.4%) and Washington (24.4%) experienced the biggest decreases.
- In the shorter period between 2022 and 2023, 11 states experienced an increase in overall STD rates. Hawaii and Maryland tied for the steepest increase, at 14.4%, followed by Delaware (6.9%). Meanwhile, Montana (18.1%) saw the biggest decrease during this period, followed by Mississippi (17.1%) and South Dakota (13.2%).
- In 2023, Louisiana had the highest combined STD rate, with 1,106.9 cases per 100,000 residents. Alaska (1,031.1) and Mississippi (982.1) followed. At the other end of the spectrum, Vermont (236.4), New Hampshire (242.4) and Maine (267.1) had the lowest STD rates.
Most commonly reported bacterial STD saw rates decline
Chlamydia remained the most commonly reported bacterial STD in the U.S. nationally between 2020 and 2024, but its rate per 100,000 residents fell by 6.5% during that period. This common STD, caused by bacteria called Chlamydia trachomatis, affects men and women. It may result in (sometimes fatal) ectopic pregnancies and permanent reproductive system damage, and transmission from mother to baby can occur during childbirth.
Rates of gonorrhea also declined sharply over the same period, dropping by 21.9%. Gonorrhea is a bacterial STD that can infect the genital tract, mouth or anus in both men and women. It commonly affects young adults, and pregnant mothers can pass the infection to their babies during childbirth.
While most STDs declined during this period, syphilis trends varied depending on the stage of the STD. These differences explain why overall syphilis rates moved in the opposite direction.
- Primary and secondary syphilis, the most infectious stages, declined by 3.2% between 2020 and 2024. These stages involve sores or rashes and indicate recent infection.
- Unknown duration or late syphilis rose by 101.4% over the same period. This category includes infections diagnosed after the early stages, often when symptoms appeared later or earlier infections went untreated.
- Congenital syphilis, which occurs when a pregnant person passes the infection to their baby, increased 82.7% during this time.
Overall, these changes increased total syphilis rates 38.4% nationally over the five years between 2020 and 2024, even as rates of the most infectious stages declined slightly.
Looking at the most recent one-year period, rates for most nationally tracked STDs declined between 2023 and 2024. During that year, chlamydia fell by 9.4% and gonorrhea by 11.0%. Total syphilis, along with primary and secondary syphilis, also declined, while congenital syphilis increased 1.7%.
National STD rates per 100,000 people
STD | 2020 | 2021 | 2022 | 2023 | 2024 | Change, 2023-24 | Change, 2020-24 |
|---|---|---|---|---|---|---|---|
| Chlamydia | 476.7 | 495.5 | 495.0 | 492.2 | 445.7 | -9.4% | -6.5% |
| Gonorrhea | 204.5 | 214.0 | 194.4 | 179.5 | 159.8 | -11.0% | -21.9% |
| Congenital syphilis | 60.0 | 78.8 | 102.9 | 107.8 | 109.6 | 1.7% | 82.7% |
| Total syphilis | 40.4 | 53.3 | 62.2 | 62.5 | 55.9 | -10.6% | 38.4% |
| Unknown duration or late syphilis | 14.2 | 20.6 | 26.3 | 29.5 | 28.6 | -3.1% | 101.4% |
| Early nonprimary, nonsecondary syphilis | 13.0 | 15.6 | 17.1 | 16.0 | 14.0 | -12.5% | 7.7% |
| Primary and secondary syphilis | 12.6 | 16.2 | 17.7 | 15.8 | 12.2 | -22.8% | -3.2% |
Source: ValuePenguin analysis of Centers for Disease Control and Prevention (CDC) data. Notes: 2024 data, as of Aug. 14, 2025, is provisional. STDs are ranked by 2024 rates.
Health insurance access may help explain national declines
Expanded access to health insurance and changes in how people receive care may have played a role in the national decline of several bacterial STDs during this period.
"The number of people without health insurance fell noticeably between 2020 and 2024, in large part because expanded pandemic-era subsidies significantly lowered the cost of Affordable Care Act (ACA) plans," says Talon Abernathy, senior health insurance writer for ValuePenguin. "That’s important because all ACA plans include coverage for STD treatment and prevention."
Abernathy also pointed to the shifts in care delivery that began during the pandemic as having a positive impact on health care access. "The dramatic increase in the availability of telehealth services and at-home testing has made it easier for individuals to get early health interventions, which are particularly important when dealing with STDs," he said.
5 states saw overall STD rates rise between 2019, 2023
Only five states saw an overall increase in combined STD rates between 2019 and 2023. (Note: National data is available through 2024, while state data is available through 2023, so we’re highlighting different five-year periods.) Those states were:
- South Dakota at 11.9%
- Texas at 11.7%
- Georgia at 9.1%
- Louisiana at 3.9%
- Florida at 2.4%
By contrast, nearly every other state saw STD rates decline during the same period. The steepest drops took place in:
- Montana at 30.8%
- Idaho at 29.4%
- Washington at 24.4%
Insurance access may help explain the divide
Meanwhile, state-level differences in health insurance access may help explain why some states moved in the opposite direction. One key factor is Medicaid expansion status, which affects whether low-income residents can access preventive health care and treatment.
KFF research shows that states without expanded Medicaid generally report higher uninsured rates, particularly among low-income adults. Limited insurance coverage can reduce access to routine STD screenings, follow-up testing and timely treatment. Notably, three of the five states with rising STD rates during this period hadn’t expanded Medicaid by the end of our analyzed period. (A fourth, South Dakota, implemented expansion in July 2023, near the end of this period.)
Abernathy explained that Affordable Care Act subsidies were designed with Medicaid expansion in mind. As a result, people earning below 100% of the federal poverty level in nonexpansion states often fall into a coverage gap where they qualify for neither Medicaid nor subsidized marketplace coverage.
That coverage gap can limit access to preventive services, such as STD screenings and treatment. When people can’t afford care, infections are more likely to go undiagnosed and untreated, which may contribute to higher rates over time.
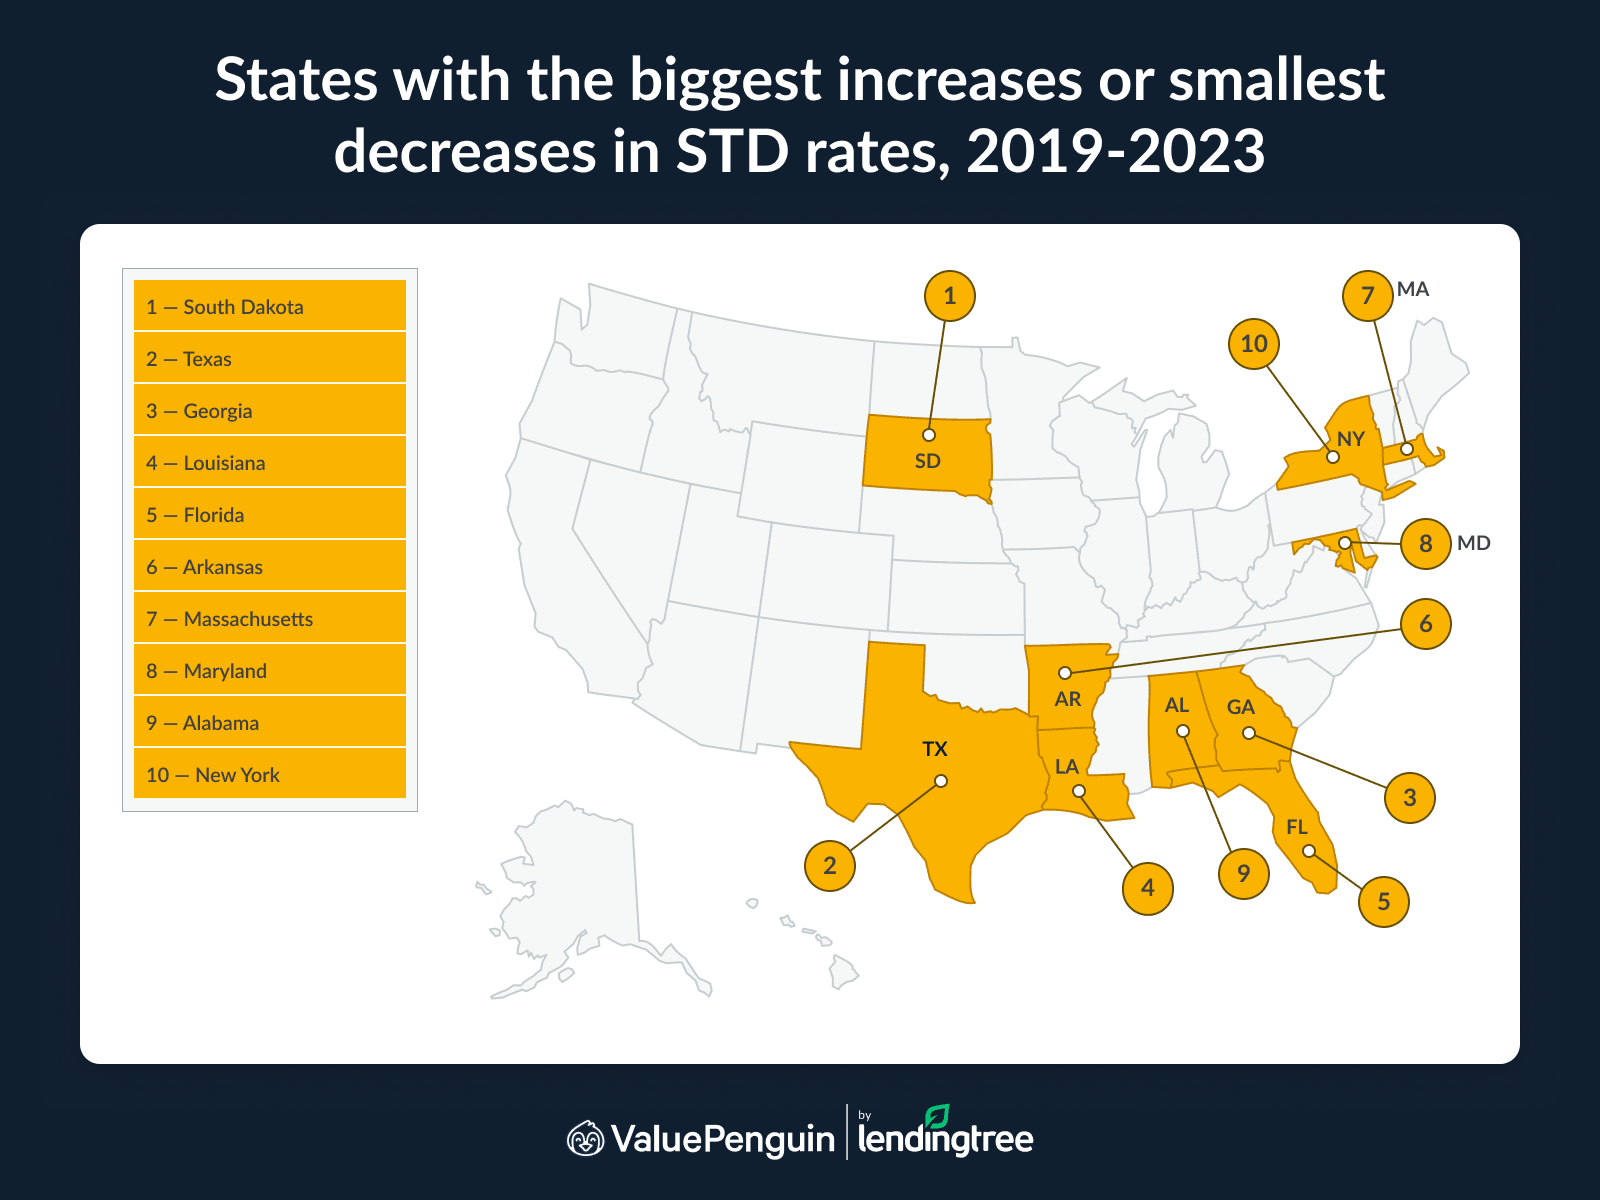
Full rankings: States with biggest increases in STD rates, 2019-23
Rank | State | Rate per 100,000 residents, 2019 | Rate per 100,000 residents, 2023 | % change |
|---|---|---|---|---|
| 1 | South Dakota | 766.8 | 858.3 | 11.9% |
| 2 | Texas | 612.0 | 683.3 | 11.7% |
| 3 | Georgia | 862.5 | 941.2 | 9.1% |
| 4 | Louisiana | 1065.0 | 1,106.9 | 3.9% |
| 5 | Florida | 708.0 | 724.9 | 2.4% |
| 6 | Arkansas | 813.2 | 802.2 | -1.4% |
| 7 | Massachusetts | 574.1 | 563.1 | -1.9% |
| 8 | Maryland | 831.5 | 801.1 | -3.7% |
| 9 | Alabama | 948.0 | 906.6 | -4.4% |
| 10 | New York | 861.7 | 808.8 | -6.1% |
| 11 | Pennsylvania | 614.8 | 575.0 | -6.5% |
| 12 | New Jersey | 537.1 | 501.3 | -6.7% |
| 13 | Nebraska | 642.4 | 594.7 | -7.4% |
| 14 | North Carolina | 941.4 | 871.0 | -7.5% |
| 14 | Rhode Island | 693.8 | 641.6 | -7.5% |
| 16 | Arizona | 830.1 | 767.3 | -7.6% |
| 17 | Delaware | 783.2 | 722.0 | -7.8% |
| 18 | Utah | 446.1 | 409.6 | -8.2% |
| 19 | Indiana | 712.6 | 643.7 | -9.7% |
| 20 | Minnesota | 585.8 | 522.7 | -10.8% |
| 21 | Alaska | 1165.7 | 1,031.1 | -11.5% |
| 22 | Illinois | 876.3 | 771.6 | -11.9% |
| 23 | Virginia | 735.7 | 641.8 | -12.8% |
| 23 | Kansas | 701.4 | 611.3 | -12.8% |
| 25 | Connecticut | 557.6 | 485.4 | -12.9% |
| 26 | Missouri | 829.5 | 722.0 | -13.0% |
| 26 | Nevada | 828.9 | 721.0 | -13.0% |
| 28 | Michigan | 689.6 | 590.1 | -14.4% |
| 29 | South Carolina | 995.7 | 851.8 | -14.5% |
| 30 | California | 822.3 | 697.6 | -15.2% |
| 31 | North Dakota | 706.8 | 596.0 | -15.7% |
| 32 | Tennessee | 853.6 | 718.6 | -15.8% |
| 32 | Hawaii | 683.3 | 575.0 | -15.8% |
| 34 | Wisconsin | 655.5 | 550.4 | -16.0% |
| 35 | Colorado | 700.2 | 579.8 | -17.2% |
| 36 | Kentucky | 642.9 | 530.4 | -17.5% |
| 37 | Ohio | 788.8 | 646.0 | -18.1% |
| 38 | New Hampshire | 297.4 | 242.4 | -18.5% |
| 39 | Iowa | 680.7 | 553.9 | -18.6% |
| 40 | Oregon | 617.1 | 498.9 | -19.2% |
| 41 | Wyoming | 458.3 | 357.7 | -22.0% |
| 42 | Maine | 343.0 | 267.1 | -22.1% |
| 43 | Vermont | 304.0 | 236.4 | -22.2% |
| 44 | New Mexico | 939.2 | 729.2 | -22.4% |
| 45 | Mississippi | 1,274.4 | 982.1 | -22.9% |
| 46 | West Virginia | 413.1 | 314.6 | -23.8% |
| 47 | Oklahoma | 882.6 | 669.3 | -24.2% |
| 48 | Washington | 668.1 | 505.3 | -24.4% |
| 49 | Idaho | 478.9 | 338.3 | -29.4% |
| 50 | Montana | 603.8 | 417.8 | -30.8% |
Source: ValuePenguin analysis of CDC data. Note: Rates are the sum of gonorrhea, primary and secondary syphilis, and chlamydia cases.
As a reminder, full study rankings use state-level data through 2023. The CDC doesn’t label that state data as provisional in the way it does 2024 national totals.
This state analysis focuses on three STDs measured per total population and commonly used to track bacterial STD trends: chlamydia, gonorrhea, and primary and secondary syphilis. It excludes congenital syphilis because the CDC measures congenital syphilis per live births, not per total population, which would distort comparisons.
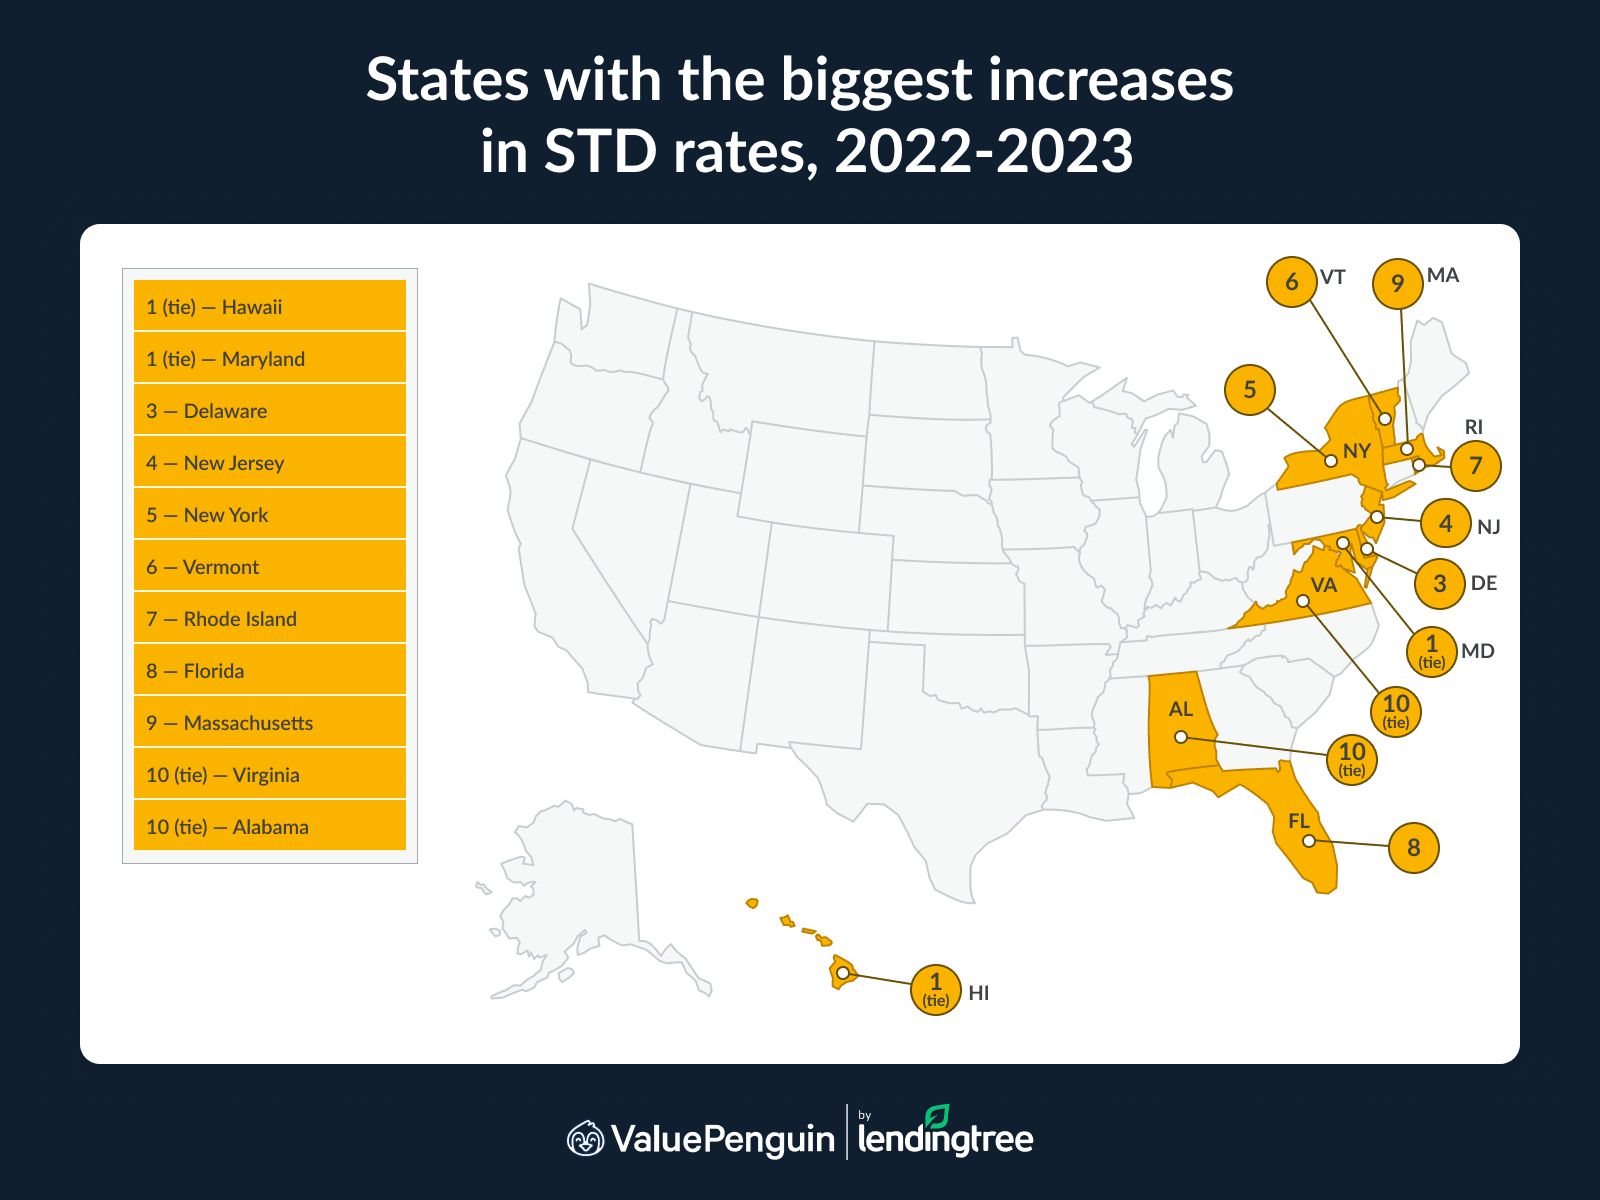
11 states experienced increase in overall STD rates between 2022, 2023
Between 2022 and 2023, 11 states recorded year-over-year increases in their combined STD rates. Hawaii and Maryland tied for the largest rise at 14.4%, followed by Delaware at 6.9%.
Other states that saw rate increases during this period include:
- New Jersey (6.8%)
- New York (5.6%)
- Vermont (4.9%)
- Rhode Island (3.6%)
- Florida (3.5%)
- Massachusetts (2.4%)
- Virginia (1.0%)
- Alabama (1.0%)
CDC data shows that STD trends shifted only slightly between 2022 and 2023 at the national level, even as individual states moved in different directions. Yet some infections, such as total syphilis, rose during this period. STD rates depend heavily on testing, diagnosis and reporting. So short-term, year-over-year changes can vary by state without necessarily indicating a broader long-term trend.
On the opposite end of the spectrum, Montana (18.1%) saw the biggest decrease in this period. Mississippi (17.1%) and South Dakota (13.2%) followed to round out the three states with the biggest decreases in STD rates between 2022 and 2023.
Full rankings: States with biggest increases in STD rates, 2022-23
Rank | State | Rate per 100,000 residents, 2022 | Rate per 100,000 residents, 2023 | % change |
|---|---|---|---|---|
| 1 | Hawaii | 502.6 | 575.0 | 14.4% |
| 1 | Maryland | 700.5 | 801.1 | 14.4% |
| 3 | Delaware | 675.5 | 722.0 | 6.9% |
| 4 | New Jersey | 469.6 | 501.3 | 6.8% |
| 5 | New York | 765.6 | 808.8 | 5.6% |
| 6 | Vermont | 225.4 | 236.4 | 4.9% |
| 7 | Rhode Island | 619.5 | 641.6 | 3.6% |
| 8 | Florida | 700.5 | 724.9 | 3.5% |
| 9 | Massachusetts | 550.1 | 563.1 | 2.4% |
| 10 | Virginia | 635.2 | 641.8 | 1.0% |
| 10 | Alabama | 897.3 | 906.6 | 1.0% |
| 12 | Pennsylvania | 577.4 | 575.0 | -0.4% |
| 13 | North Carolina | 875.9 | 871.0 | -0.6% |
| 14 | Michigan | 601.2 | 590.1 | -1.8% |
| 15 | Connecticut | 495.4 | 485.4 | -2.0% |
| 16 | Wyoming | 365.3 | 357.7 | -2.1% |
| 17 | Illinois | 790.6 | 771.6 | -2.4% |
| 18 | California | 719.3 | 697.6 | -3.0% |
| 19 | Alaska | 1063.6 | 1031.1 | -3.1% |
| 19 | Louisiana | 1142.4 | 1106.9 | -3.1% |
| 21 | Minnesota | 540.5 | 522.7 | -3.3% |
| 22 | Georgia | 974.0 | 941.2 | -3.4% |
| 22 | Maine | 276.5 | 267.1 | -3.4% |
| 24 | New Mexico | 761.3 | 729.2 | -4.2% |
| 25 | Oregon | 521.5 | 498.9 | -4.3% |
| 26 | Utah | 429.4 | 409.6 | -4.6% |
| 27 | Ohio | 679.0 | 646.0 | -4.9% |
| 28 | Arkansas | 844.2 | 802.2 | -5.0% |
| 28 | Arizona | 807.7 | 767.3 | -5.0% |
| 30 | New Hampshire | 255.5 | 242.4 | -5.1% |
| 31 | Nebraska | 630.2 | 594.7 | -5.6% |
| 32 | West Virginia | 333.9 | 314.6 | -5.8% |
| 32 | Washington | 536.3 | 505.3 | -5.8% |
| 34 | Indiana | 686.6 | 643.7 | -6.2% |
| 35 | Nevada | 770.4 | 721.0 | -6.4% |
| 36 | Colorado | 622.4 | 579.8 | -6.8% |
| 37 | Kansas | 656.3 | 611.3 | -6.9% |
| 38 | Kentucky | 572.7 | 530.4 | -7.4% |
| 39 | Texas | 739.8 | 683.3 | -7.6% |
| 40 | Wisconsin | 596.6 | 550.4 | -7.7% |
| 41 | Tennessee | 782.0 | 718.6 | -8.1% |
| 42 | Iowa | 607.1 | 553.9 | -8.8% |
| 42 | Idaho | 370.9 | 338.3 | -8.8% |
| 44 | Missouri | 793.3 | 722.0 | -9.0% |
| 45 | North Dakota | 666.5 | 596.0 | -10.6% |
| 46 | Oklahoma | 757.3 | 669.3 | -11.6% |
| 46 | South Carolina | 963.8 | 851.8 | -11.6% |
| 48 | South Dakota | 988.5 | 858.3 | -13.2% |
| 49 | Mississippi | 1,184.2 | 982.1 | -17.1% |
| 50 | Montana | 509.9 | 417.8 | -18.1% |
Source: ValuePenguin analysis of CDC data. Note: Rates are the sum of gonorrhea, primary and secondary syphilis, and chlamydia cases.
Louisiana had highest combined STD rate in 2023
Louisiana recorded the highest combined STD rate in the country in 2023 — 1,106.9 cases per 100,000 residents. Alaska (1,031.1) and Mississippi (982.1) followed, with several Southern states also ranking near the top.
Research points to health insurance coverage and access to health care as key drivers behind these differences:
- High uninsured rates: Alaska, Mississippi and Louisiana rank among the states with high uninsured populations, which limits access to routine STD screenings and timely treatment.
- Medicaid expansion status: Mississippi hasn’t expanded Medicaid, contributing to coverage gaps for low-income adults.
- Geographic barriers: Alaska expanded Medicaid, but its large size, remote communities and limited provider access still create barriers to health care.
"Access to coverage and medical services likely explains much of this difference," Abernathy says. "Alaska, Mississippi and Louisiana all have large populations of people who don’t have health insurance. Mississippi chose not to adopt expanded Medicaid, which goes a long way toward explaining why so many residents lack coverage."
At the other end of the rankings, Vermont (236.4), New Hampshire (242.4) and Maine (267.1) reported the lowest STD rates nationwide. These states also share:
- Low uninsured rates
- Broad access to health care services
"Vermont, New Hampshire and Maine all have very few people without health insurance," Abernathy says. "When combined with other factors, such as an aged population and strong access to health services, it’s not surprising that these three states tend to have low STD rates at the population level."
Full rankings: States with highest STD rates, 2023
Rank | State | Rate per 100,000 residents, 2023 |
|---|---|---|
| 1 | Louisiana | 1,106.9 |
| 2 | Alaska | 1,031.1 |
| 3 | Mississippi | 982.1 |
| 4 | Georgia | 941.2 |
| 5 | Alabama | 906.6 |
| 6 | North Carolina | 871.0 |
| 7 | South Dakota | 858.3 |
| 8 | South Carolina | 851.8 |
| 9 | New York | 808.8 |
| 10 | Arkansas | 802.2 |
| 11 | Maryland | 801.1 |
| 12 | Illinois | 771.6 |
| 13 | Arizona | 767.3 |
| 14 | New Mexico | 729.2 |
| 15 | Florida | 724.9 |
| 16 | Missouri | 722.0 |
| 16 | Delaware | 722.0 |
| 18 | Nevada | 721.0 |
| 19 | Tennessee | 718.6 |
| 20 | California | 697.6 |
| 21 | Texas | 683.3 |
| 22 | Oklahoma | 669.3 |
| 23 | Ohio | 646.0 |
| 24 | Indiana | 643.7 |
| 25 | Virginia | 641.8 |
| 26 | Rhode Island | 641.6 |
| 27 | Kansas | 611.3 |
| 28 | North Dakota | 596.0 |
| 29 | Nebraska | 594.7 |
| 30 | Michigan | 590.1 |
| 31 | Colorado | 579.8 |
| 32 | Hawaii | 575.0 |
| 32 | Pennsylvania | 575.0 |
| 34 | Massachusetts | 563.1 |
| 35 | Iowa | 553.9 |
| 36 | Wisconsin | 550.4 |
| 37 | Kentucky | 530.4 |
| 38 | Minnesota | 522.7 |
| 39 | Washington | 505.3 |
| 40 | New Jersey | 501.3 |
| 41 | Oregon | 498.9 |
| 42 | Connecticut | 485.4 |
| 43 | Montana | 417.8 |
| 44 | Utah | 409.6 |
| 45 | Wyoming | 357.7 |
| 46 | Idaho | 338.3 |
| 47 | West Virginia | 314.6 |
| 48 | Maine | 267.1 |
| 49 | New Hampshire | 242.4 |
| 50 | Vermont | 236.4 |
Source: ValuePenguin analysis of CDC data. Note: Rates are the sum of gonorrhea, primary and secondary syphilis, and chlamydia cases.
STD screenings, treatments and health insurance: 4 things to know
Health insurance can play a major role in how quickly people get tested and treated for STDs. Coverage affects cost, convenience and access to preventive care, especially for people who want to stay proactive about their sexual health.
Here are four key things to know.
1. Many health plans cover preventive STD screenings
"Most ACA health insurance plans cover preventive screenings for common STDs, such as chlamydia, gonorrhea and HIV, when medically recommended," Abernathy says. Health experts recommend regular screenings for at-risk populations, so talk to your doctor before scheduling an appointment.
2. Use in-network care to reduce out-of-pocket expenses
In-network doctors, clinics, labs and hospitals often cost much less than out-of-network care. That’s true whether you’re getting routine STD tests or follow-up treatment. If you’re unsure how your health insurance plan works, check your provider directory or ask customer service before you schedule care.
3. Telehealth can make testing and treatment easier
For greater convenience and speed, consider taking advantage of telehealth services, Abernathy recommends. Telehealth rarely replaces all in-person care, but in many cases, it can offer rapid guidance, prescriptions and testing referrals without a long wait. Many insurance plans now include telehealth for sexual health consultations, which can be especially helpful if you live in an area where clinics are far apart.
4. If you don’t have insurance, check your eligibility first
Being uninsured shouldn’t mean going without care. See if you’re eligible for Medicaid or a subsidized plan through open enrollment (or through a qualifying event). If you don’t qualify now, ValuePenguin’s cheap health insurance guide shows ways to find lower-cost coverage options.
Also look into other options available in your local community. "If you can’t get Medicaid or an ACA plan, it’s a good idea to search for free or low-cost neighborhood clinics," Abernathy says.
Additionally, you can order at-home STD test kits online or through pharmacies. Pricing varies by panel and provider, ranging anywhere from $20 to more than $200. Samples go to a lab for confidential results.
Methodology
ValuePenguin researchers analyzed Centers for Disease Control and Prevention (CDC) data to estimate STD rates per 100,000 residents. Nationally, we looked at:
- Chlamydia
- Congenital syphilis
- Early nonprimary, nonsecondary syphilis
- Gonorrhea
- Primary and secondary syphilis
- Total syphilis
- Unknown duration or late syphilis
Researchers calculated changes nationally between 2020 and 2024, and 2023 and 2024 for each STD. 2024 data, pulled Aug. 14, 2025, is provisional.
At the state level, analysts examined combined rates for gonorrhea, primary and secondary syphilis, and chlamydia, then calculated changes between 2019 and 2023, and between 2022 and 2023.
About the Author

Insurance Writer
Michelle Lambright Black, Founder of CreditWriter.com and HerCreditMatters.com, is a leading credit expert and personal finance writer with nearly two decades of experience in the credit industry. She’s an expert on credit reporting, credit scoring, identity theft, and the intersection of credit and financing. You can connect with Michelle on Twitter (@MichelleLBlack) and Instagram (@CreditWriter).
Editorial note: The content of this article is based on the author's opinions and recommendations alone. It has not been previewed, commissioned or otherwise endorsed by any of our network partners.