Vehicle Theft Statistics by State — and Most Stolen Cars and Motorcycles
Overall, car thefts in the U.S. went down about 3% over the past five years.
But in many cities, thefts are still rising, and certain vehicles are now much bigger targets. For example, the Hyundai Elantra and Sonata were the two most stolen cars in 2024. But neither model appeared in the top 10 only two years earlier.
Find Cheap Car Insurance Quotes in Your Area
Auto theft statistics
Car theft statistics
A total of 850,708 cars were stolen in the U.S. in 2024.
That means one car was stolen every 37 seconds.
However, car theft rates are going down across the country. There were 17% fewer car thefts in 2024 than in 2023. And thefts are down 3% over the past five years, despite a consistent increase in thefts from 2020 to 2023.
How many cars are stolen each year?
Car theft statistics by year
Year | Cars stolen | % change |
|---|---|---|
| 2024 | 850,708 | -17% |
| 2023 | 1,020,729 | 1% |
| 2022 | 1,008,756 | 8% |
| 2021 | 932,329 | 6% |
Data is from the National Insurance Crime Bureau (NICB).
Most stolen cars in America
The Hyundai Elantra is the most stolen vehicle in the U.S., with over 31,000 stolen in 2024.
Sedans are the most commonly stolen type of car, accounting for six of the top 10 most stolen cars.
The Chevy Silverado 1500 is the most stolen truck, with over 21,000 thefts.
Top 10 most stolen automobiles
Find Cheap Car Insurance Quotes in Your Area
Top 10 most stolen cars in America
Vehicle | Thefts |
|---|---|
| Hyundai Elantra | 31,712 |
| Hyundai Sonata | 26,720 |
| Chevrolet Silverado 1500 | 21,666 |
| Honda Accord | 18,539 |
| Kia Optima | 17,493 |
Data is from the National Insurance Crime Bureau (NICB).
Car thieves may target specific car models that are popular or in high demand, regardless of their value. Some of these vehicles may also have parts that are expensive or easy to sell.
If your car is stolen, you should report it to the police immediately.
About 34% of recovered stolen vehicles are recovered on the same day as the theft. And 45% of recovered vehicles are found within two days.
The Hyundai Elantra is also the most stolen car in 22 states — more states than any other make and model. But that doesn't mean it's the most commonly stolen car in your state.
For example, the most stolen car in California and Texas, two of the largest states in the U.S., is the Chevrolet Silverado 1500.
Most stolen cars by state
State | Vehicle | Thefts |
|---|---|---|
| Alabama | Toyota Camry | 219 |
| Alaska | Chevrolet Silverado 1500 | 61 |
| Arizona | Hyundai Elantra | 649 |
| Arkansas | Chevrolet Silverado 1500 | 178 |
| California | Chevrolet Silverado 1500 | 6,248 |
U.S. states with most auto thefts
California has the highest number of stolen cars in the nation, at over 181,000.
That's nearly twice as many as Texas, the state with the second-highest number of thefts (97,246).
California and Texas have much larger populations than most states, which likely contributes to the higher number of thefts there. In fact, both states lead the nation with the most registered vehicles. Together, they make up around 19% of the total cars registered in the U.S.
Automobile theft statistics by state
Top 10 states with the most stolen cars in 2024
State | Cars stolen |
|---|---|
| California | 181,571 |
| Texas | 97,246 |
| Florida | 37,295 |
| Illinois | 34,047 |
| Washington | 29,471 |
States with the highest vehicle theft rates
Washington, D.C., has the highest car theft rate in the country, at 842.4 stolen vehicles per 100,000 people. That's significantly more than California, which has the second-highest theft rate, at 463.21.
Top 10 states with the highest vehicle theft rates per 100,000 people
State | Theft rate |
|---|---|
| Washington, D.C. | 842.40 |
| California | 463.21 |
| New Mexico | 458.24 |
| Colorado | 430.04 |
| Nevada | 394.42 |
States with the biggest decreases in motor vehicle thefts, 2023 to 2024
Motor vehicle thefts decreased the most in Washington, Nevada and Oregon. All three states saw car thefts drop by at least 30% between 2023 and 2024.
State | % decrease |
|---|---|
| Washington | -32% |
| Nevada | -31% |
| Oregon | -30% |
| Nebraska | -29% |
| Colorado | -26% |
In contrast, Maine was the only state that saw a year-over-year increase in motor vehicle thefts. Car thefts went up by 2% in Maine between 2023 and 2024.
Car theft rates ranked by state
Car theft rates ranked by state
State | Total thefts | Theft rate | % change |
|---|---|---|---|
| California | 181,571 | 463 | -14% |
| Texas | 97,246 | 316 | -16% |
| Florida | 37,295 | 163 | -21% |
| Illinois | 34,047 | 269 | -19% |
| Washington | 29,471 | 375 | -32% |
Cities with the most vehicle thefts
The Los Angeles-Long Beach-Anaheim area had the highest number of car thefts in 2024, at 66,565. That's significantly more than the San Francisco-Oakland-Fremont metro, which had 34,876 car thefts.
While it’s difficult to pinpoint why these metros rank highest, it’s worth noting that crime rates generally tend to be higher in urban areas like these.
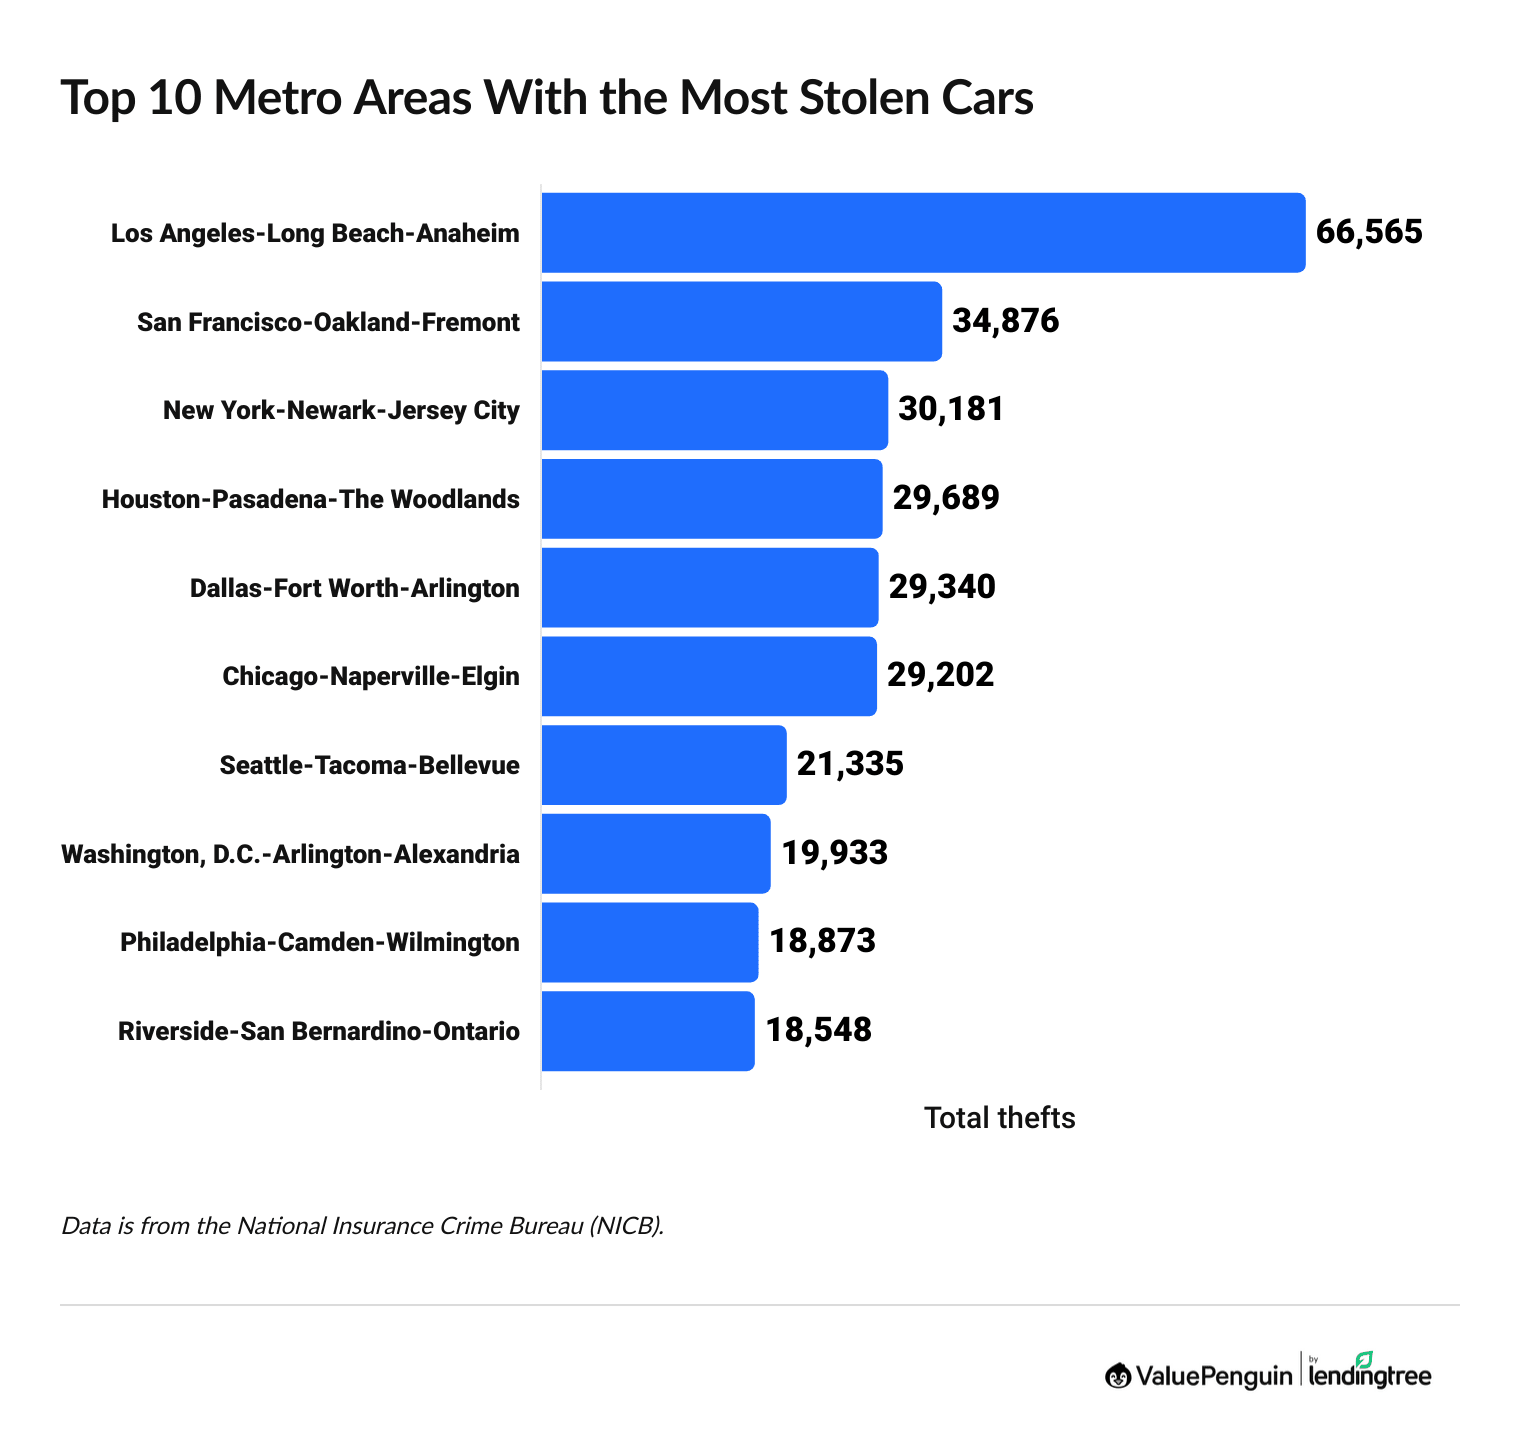
Top 10 highest car theft cities of 2024
Metro area | Car thefts |
|---|---|
| Los Angeles-Long Beach-Anaheim, CA | 66,565 |
| San Francisco-Oakland-Fremont, CA | 34,876 |
| New York-Newark-Jersey City, NY-NJ | 30,181 |
| Houston-Pasadena-The Woodlands, TX | 29,689 |
| Dallas-Fort Worth-Arlington, TX | 29,340 |
City with the most stolen cars per 100,000 people
The San Francisco-Oakland-Fremont metro area had the highest theft rate in the country. In 2024, more than 763 cars were stolen for every 100,000 people living in the area.
Metro area | Theft rate |
|---|---|
| San Francisco-Oakland-Fremont, CA | 763.66 |
| Memphis, TN-MS-AR | 714.92 |
| Bakersfield-Delano, CA | 701.01 |
| Albuquerque, NM | 668.22 |
| Pueblo, CO | 654.58 |
Cities with the highest increase in car thefts, 2023 to 2024
Vehicle thefts jumped the most in Watertown-Fort Drum, NY, rising by 55% between 2023 and 2024. That’s followed by Sheboygan, WI, and State College, PA.
Metro area | % increase |
|---|---|
| Watertown-Fort Drum, NY | 55% |
| Sheboygan, WI | 47% |
| State College, PA | 44% |
| Flagstaff, AZ | 35% |
| Gettysburg, PA | 33% |
Cities with the greatest decrease in auto thefts, 2023 to 2024
Ithaca, NY, Carbondale-Marion, IL, and Wausau, WI, all saw car thefts drop by more than 50% from 2023 to 2024.
Metro area | % decrease |
|---|---|
| Ithaca, NY | -56% |
| Carbondale-Marion, IL | -53% |
| Wausau, WI | -52% |
| Bremerton-Silverdale-Port Orchard, WA | -49% |
| Altoona, PA | -45% |
Cities with the most stolen cars
Big cities usually see more car thefts simply because more people live and drive there. But size isn’t the only factor.
Crime rates and the kinds of cars that are popular in each area also affect thefts. For example, a city where many people drive older sedans lacking anti-theft technology may have higher theft rates.
Metro area | Total thefts | Theft rate | % change |
|---|---|---|---|
| Los Angeles-Long Beach-Anaheim, CA | 66,565 | 520 | -9% |
| San Francisco-Oakland-Fremont, CA | 34,876 | 764 | -16% |
| New York-Newark-Jersey City, NY-NJ | 30,181 | 155 | -11% |
| Houston-Pasadena-The Woodlands, TX | 29,689 | 395 | -16% |
| Dallas-Fort Worth-Arlington, TX | 29,340 | 362 | -15% |
Auto theft statistics by time of day
Not surprisingly, thieves target cars more often at night, with more than half, 54%, of all car thefts occurring between noon and 11:59 p.m.
This is despite the hour between midnight and 12:59 a.m. having the most vehicle thefts overall. There were 61,372 thefts during that time slot in 2024 — 8% of all thefts.
Time of day | Thefts | % |
|---|---|---|
| Midnight-12:59 a.m. | 61,372 | 8% |
| 1 a.m.-1:59 a.m. | 24,124 | 3% |
| 2 a.m.-2:59 a.m. | 22,287 | 3% |
| 3 a.m.-3:59 a.m. | 20,306 | 3% |
| 4 a.m.-4:59 a.m. | 18,268 | 2% |
Data is for 2024 thefts as reported by the FBI National Incident-Based Reporting System.
Motorcycle thefts in the U.S.
There were 54,732 motorcycles stolen in 2022. That's nearly 150 bikes stolen every day. Luckily, more than 40% of motorcycles stolen in 2022 were later found.
Motorcycle thefts went up by 7% between 2021 and 2022. That increase is similar to auto thefts, which went up by 8% over the same period.
Motorcycle thefts per year
How many motorcycles are stolen each year?
Year | Motorcycles stolen | % change |
|---|---|---|
| 2022 | 54,732 | 7% |
| 2021 | 51,291 | -3% |
| 2020 | 53,111 | 30% |
| 2019 | 40,830 | -2% |
| 2018 | 41,674 | -6% |
| 2017 | 44,268 | -5% |
| 2016 | 46,467 | - |
Motorcycle theft data is from the NICB.
Motorcycle thefts by state
California had the highest number of stolen motorcycles in 2022, followed by Florida and Texas.
This isn't surprising, since these are the three most populous states in the U.S., with more motorcycles on the road than most other states. However, they tend to have fewer registered motorcycles per capita than average.
States with the most stolen motorcycles in 2022
State | Thefts | Registered bikes per 100K residents |
|---|---|---|
| California | 9,838 | 2,390 |
| Florida | 4,563 | 2,917 |
| Texas | 4,145 | 1,283 |
States with the most registered motorcycles
California has the most motorcycles of any state in the U.S. In 2023, there were 936,809 registered motorcycles in California.
Montana has the greatest number of motorcycles per capita, at 6,825 registered bikes for every 100,000 residents.
Registered motorcycles by state in 2023
State | Registered bikes | Bikes per 100K residents |
|---|---|---|
| Montana | 77,212 | 6,825 |
| New Hampshire | 90,235 | 6,435 |
| South Dakota | 54,596 | 5,945 |
| Wisconsin | 320,021 | 5,396 |
| Iowa | 171,380 | 5,325 |
Data on the number of registered motorcycles is from the Insurance Institute for Highway Safety. Population data is from the U.S. Census.
Most stolen motorcycle brands
Honda is the most commonly stolen motorcycle brand.
In 2022, 10,631 Honda motorcycles were stolen. That’s not surprising, considering that Honda is also the most popular motorcycle brand in the U.S.
Top 5 most stolen motorcycle makes in 2022
Make | Motorcycles stolen |
|---|---|
| Honda | 10,631 |
| Yamaha | 8,358 |
| Harley-Davidson | 6,333 |
| Kawasaki | 6,260 |
| Suzuki | 4,886 |
Motorcycle theft rates are from the NICB.
How auto insurance treats motor theft: Expert tips
Nobody expects to have their car or motorcycle stolen — so you may not know what to do if it is. According to ValuePenguin auto insurance expert Divya Sangameshwar, there are a few key things you should know about how your insurance company handles motorcycle theft:
- Your car insurance only covers a stolen vehicle if you have comprehensive coverage. "Comprehensive insurance also covers a stolen stereo, catalytic converter or anything else that is a part of your car," she says. "Other types of coverage, like liability and collision coverage, don't cover a stolen car."
- It's best to file a police report within 24 hours of the car theft. "The faster the police can begin searching for your stolen car, the more likely they are to find it," Sangameshwar says. "It also means you'll be able to start the claim process sooner. When filing your police report, be thorough and honest. You don’t want to be caught in a lie when the police investigate. Unfortunately, because some people lie about their car being stolen to commit insurance fraud, the police will need to rule you out as a suspect."
- After filing your report, immediately call your insurance company to start the claim process. "Your auto insurance company will ask for information like the police report, your car’s title, location of all the keys before and after the theft, the details of everyone who has access to your car, a description of your vehicle, your insurance policy account number and more," she says. "They’ll use this information to evaluate your insurance claim and decide its payout offer."
- Your insurance company may also run a credit check. "If you have significant debt and file a claim for a stolen vehicle, it may raise questions about whether you're trying to commit fraud, and it could increase the likelihood of your claim being denied," she says.
Methodology
ValuePenguin researchers analyzed motor vehicle and motorcycle theft data from the National Insurance Crime Bureau (NICB).
Motorcycle registration data is from the Insurance Institute for Highway Safety (IIHS). Population data is from the U.S. Census Bureau.
About the Author

Senior Writer
Lindsay Bishop is a Senior Writer at ValuePenguin, where she educates readers about home, auto, renters, flood and motorcycle insurance.
Lindsay began her career in the insurance and financial industry in 2010. She was a licensed auto, home, life and health insurance agent and held Series 6 and 63 financial licenses.
After a hiatus from the financial sector, Lindsay returned to the industry as a content writer for ValuePenguin in 2021. She enjoys having the opportunity to help readers make smart decisions about their insurance so they can be prepared for anything life throws their way.
When Lindsay isn't writing about insurance, you can find her spending time with family, enjoying the outdoors on Sunday long runs or riding her Peloton.
How insurance helped Lindsay
As a homeowner for 15 years located in South Carolina, Lindsay has plenty of experience navigating the coastal insurance market and managing the claims process. That includes successfully negotiating a full roof replacement claim.
Expertise
- Home insurance
- Car insurance
- Flood insurance
- Renters insurance
- Motorcycle insurance
Referenced by
- CNBC
- Yahoo Finance
- Miami Herald
Education
- BS/BA Economics, University of Nevada Las Vegas
Editorial Note: The content of this article is based on the author's opinions and recommendations alone. It has not been previewed, commissioned or otherwise endorsed by any of our network partners.