How US and State Fertility Rates Have Changed Since 2005
The U.S. fertility rate has dropped to its lowest level in decades — and the number of births is far lower than deaths in many states.
We looked at fertility rates (or the number of births per 1,000 women ages 15 to 44) across each state. Here’s what we found.
On this page
Key findings
- The U.S. fertility rate declined by 18.4% between 2005 and 2023. In 2005, there were 66.7 births per 1,000 women ages 15 to 44. That fell to 54.4 in 2023.
- Utah experienced the largest fertility rate decline in the studied period. In 2005, there were 92.8 births per 1,000 women in Utah, which fell 35.8% to 59.6 in 2023. Despite the biggest decline, the state had the eighth-highest fertility rate in 2023. Fellow Western states Arizona (32.8%) and Nevada (31.3%) had the next biggest declines.
- Southern states generally had the smallest fertility rate declines. Louisiana ranked first, with fertility rates falling just 2.6%. Notably, it tied for the sixth-highest fertility rate in 2023. North Dakota (4.3%) and Kentucky (7.1%) had the next smallest declines. In total, four of the five states with the smallest drops were in the South.
- More narrowly, just one state didn’t experience a fertility rate decline between 2022 and 2023. North Dakota was the only exception, where the rate remained the same. Meanwhile, Maine (5.4%), Delaware (5.1%) and Vermont (5.0%) saw the biggest decreases during this period.
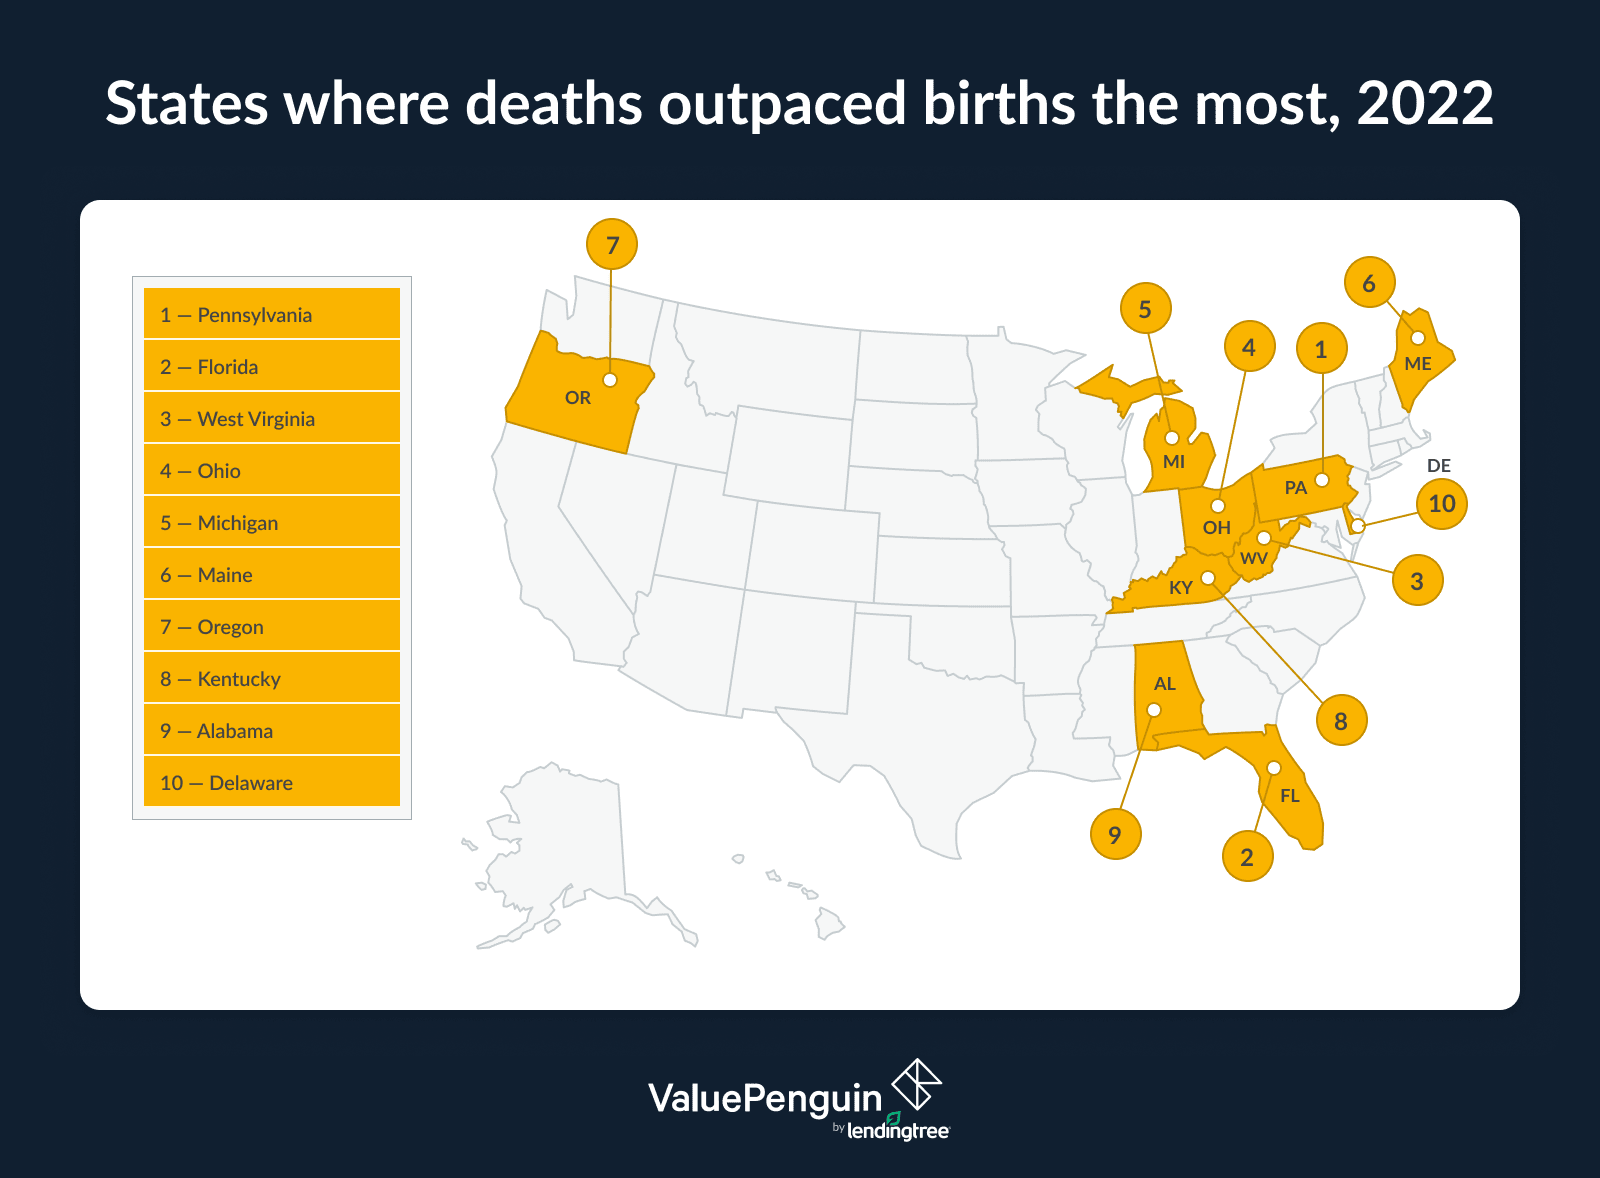
- Deaths outpaced births in 21 states. Pennsylvania saw the biggest discrepancy between births and deaths in 2022 — the latest available year for both data points. That year in the state, there were 147,181 deaths and 130,252 births, or 16,929 more deaths. Florida (14,686) and West Virginia (10,578) had the next biggest surpluses in deaths.
U.S. fertility rate falls 18.4%
Between 2005 and 2023, the U.S. fertility rate fell by 18.4%. To give context, there were 66.7 births per 1,000 women ages 15 to 44 in 2005. That fell to 54.4 in 2023 — the lowest in the analyzed period.
Fertility rate by year
Year | Fertility rate |
|---|---|
| 2023 | 54.4 |
| 2022 | 56.0 |
| 2021 | 56.3 |
| 2020 | 56.0 |
| 2019 | 58.3 |
| 2018 | 59.1 |
| 2017 | 60.3 |
| 2016 | 62.0 |
| 2015 | 62.5 |
| 2014 | 62.9 |
| 2013 | 62.5 |
| 2012 | 63.0 |
Source: ValuePenguin analysis of Centers for Disease Control and Prevention (CDC) data. Note: The fertility rate is births per 1,000 women ages 15 to 44.
According to ValuePenguin health insurance expert Divya Sangameshwar, child care costs hinder a lot of Americans from having kids. In fact, a recent LendingTree report found that the cost of raising a child rose 35.7% over two years alone.
"The rising cost associated with having a child, combined with inflation and job insecurity, could prompt families to delay or forego having children," she says. "For women who don’t have adequate insurance coverage, the costs associated with pregnancy, childbirth and postnatal care will set them more than $18,000 for a vaginal delivery. Even with insurance coverage, the average cost of giving birth is $6,940. These high costs are also a deterrent to having children."
According to the Pew Research Center, changes in fertility rates can also be attributed to cultural changes, including Americans delaying or forgoing marriage. As women put off marriage, the birth rate for single women is less than half that of married women. Women are also putting off having children until later or forgoing having children altogether.
Meanwhile, teen fertility rates also play a large role. Teen fertility has fallen dramatically, decreasing from 21.1 in 2005 to 6.7 in 2019 among those ages 15 to 17 (the latest year of data available for this demographic). Pew largely attributes this to an increase in birth control and contraceptive use and general pregnancy prevention education.
Western states saw biggest drop in fertility rates
By state, Utah saw the biggest fertility rate drop. Here, fertility rates fell 35.8% from 92.8 in 2005 to 59.6 in 2023. Still, it’s worth noting that the state had the eighth-highest fertility rate in 2023.
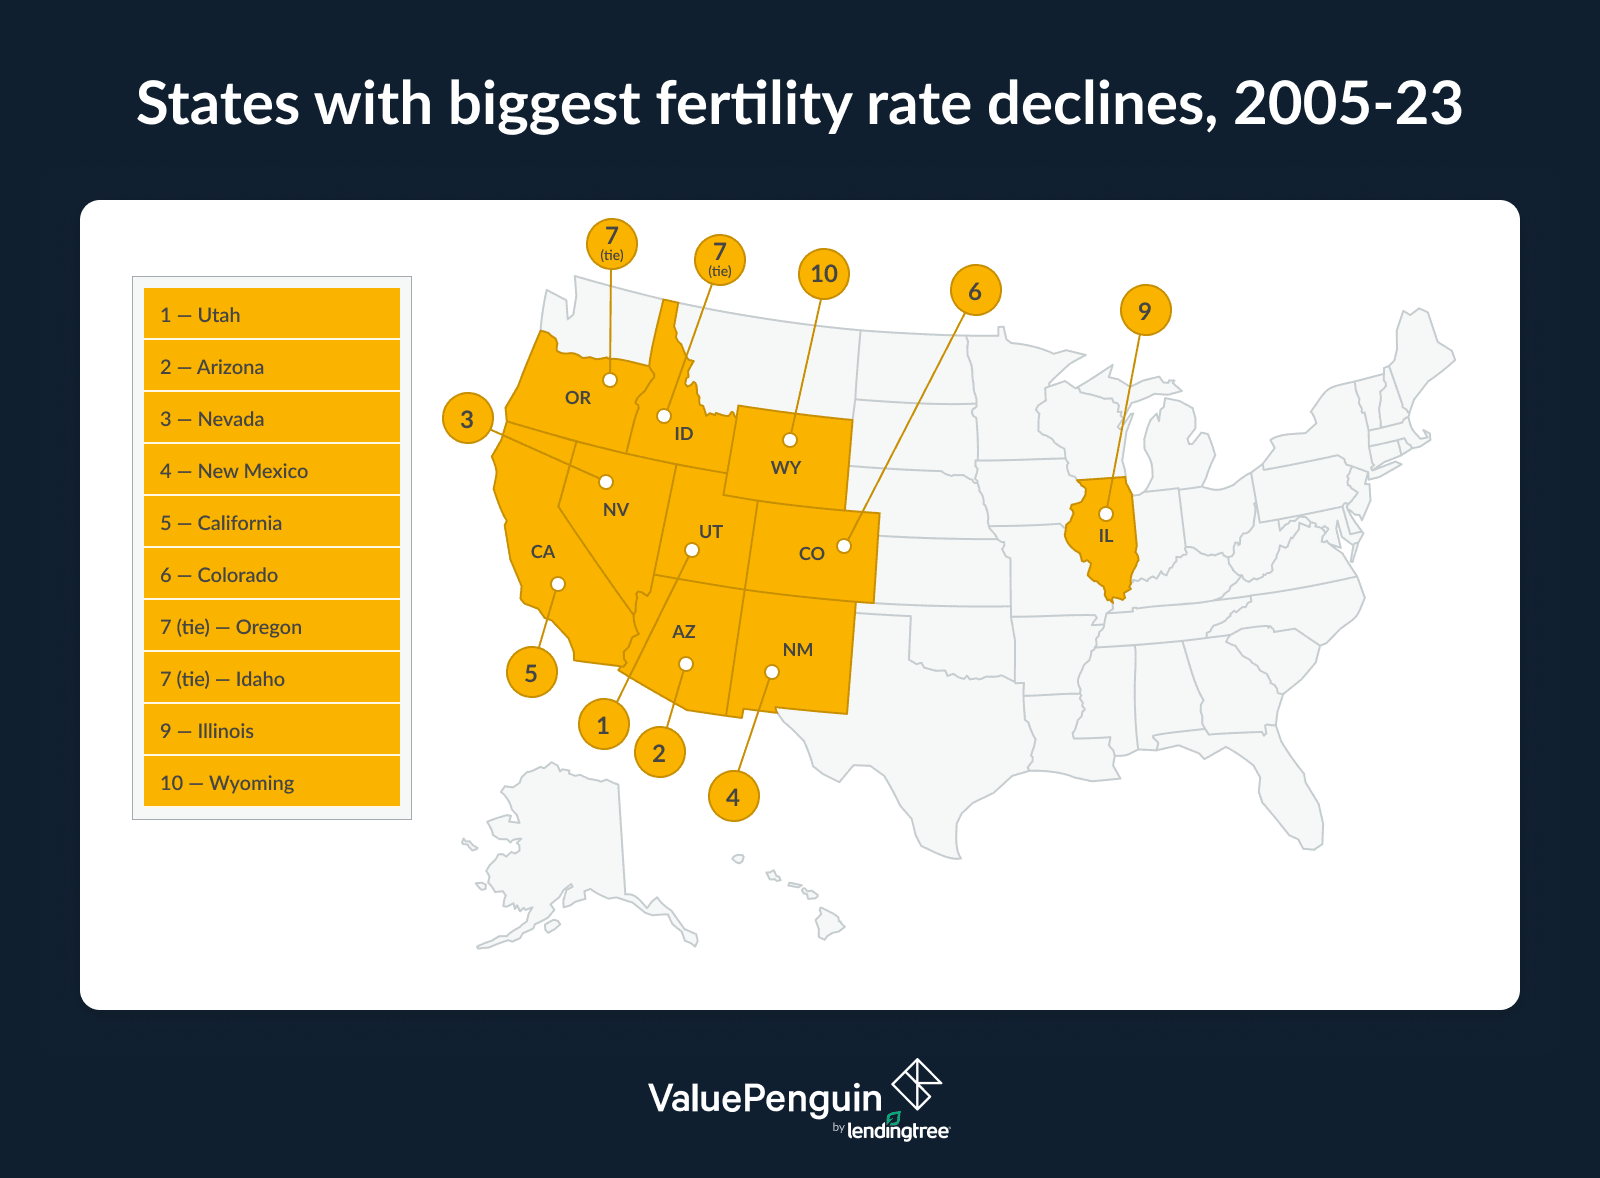
Arizona (32.8%) followed, with the fertility rate falling from 80.6 to 54.2. Nevada (31.3%) rounded out the top three, dropping from 73.9 to 50.8. Unlike Utah, both states had 2023 fertility rates slightly below the national rate of 54.4.
When looking at the states with the lowest fertility rates in 2023, Vermont (42.1), Rhode Island (45.2) and Oregon (45.9) were at the bottom.
Southern states saw smallest drop
Conversely, Southern states generally had the smallest fertility rate drops. That’s led by Louisiana, which saw fertility rates drop just 2.6%, going from 62.0 to 60.4 per 1,000 women. Also worth noting, it tied for the sixth-highest fertility rate in 2023.
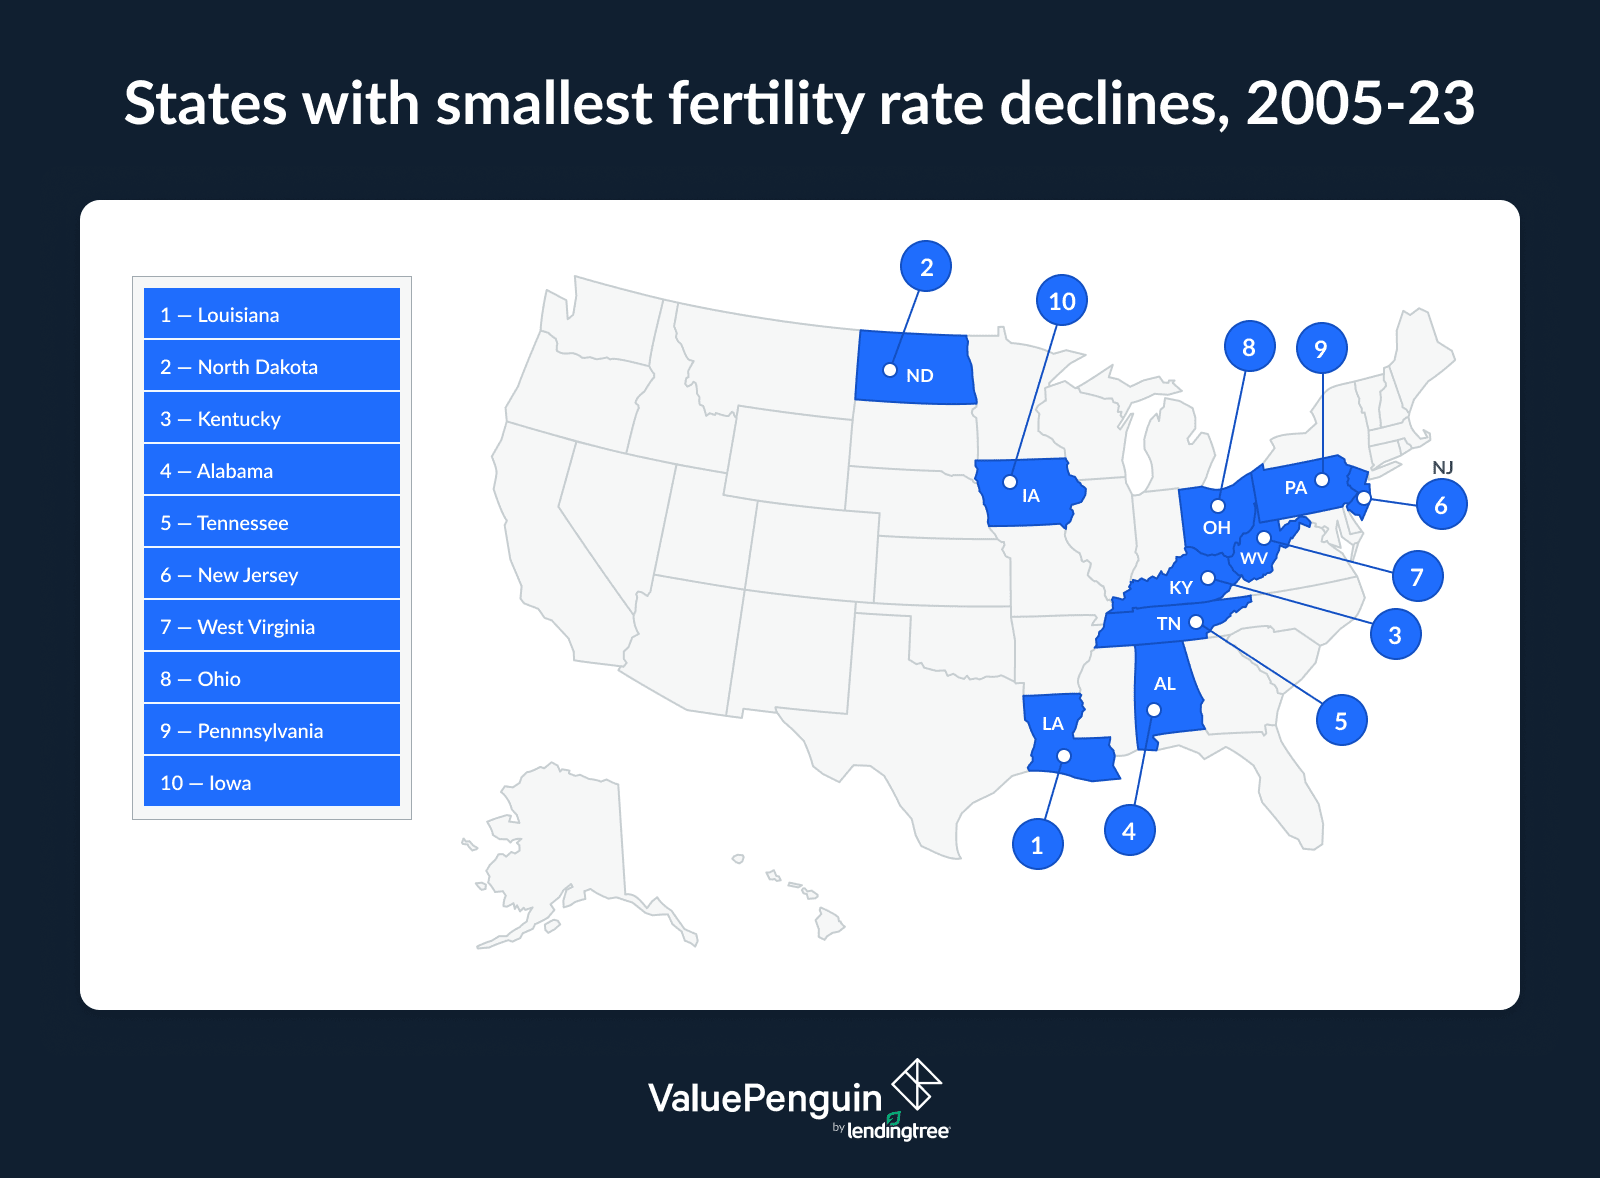
North Dakota (4.3%) followed, with fertility rates falling from 64.8 to 62.0. Kentucky (7.1%) rounded out the bottom three, with fertility rates dropping from 65.0 to 60.4.
In total, four of the five states with the smallest drops were in the South, with Alabama and Tennessee joining Louisiana and Kentucky.
When looking at the states with the highest fertility rates in 2023, South Dakota (65.6), Nebraska (62.5) and Alaska (62.4) ranked highest.
Full rankings
Change in fertility rates, 2005-23 (by state)
Rank | State | 2005 fertility rate | 2023 fertility rate | % change |
|---|---|---|---|---|
| 1 | Utah | 92.8 | 59.6 | -35.8% |
| 2 | Arizona | 80.6 | 54.2 | -32.8% |
| 3 | Nevada | 73.9 | 50.8 | -31.3% |
| 4 | New Mexico | 73.0 | 51.5 | -29.5% |
| 5 | California | 70.5 | 50.4 | -28.5% |
| 6 | Colorado | 69.6 | 50.2 | -27.9% |
| 7 | Oregon | 62.9 | 45.9 | -27.0% |
| 7 | Idaho | 78.9 | 57.6 | -27.0% |
| 9 | Illinois | 67.0 | 50.4 | -24.8% |
| 10 | Wyoming | 71.4 | 54.5 | -23.7% |
| 11 | Georgia | 71.4 | 54.9 | -23.1% |
| 12 | Texas | 77.4 | 60.6 | -21.7% |
Source: ValuePenguin analysis of CDC data. Note: The fertility rate is births per 1,000 women ages 15 to 44.
North Dakota didn’t see fertility rate drop from 2022 to 2023
Looking between 2022 and 2023, just one state didn’t experience a fertility rate decline: North Dakota, where rates remained at 62.0 both years. Following, Tennessee (0.7%) and Mississippi (0.8%) saw the smallest decreases — being the only ones with decreases below 1.0%.
Conversely, Maine (5.4%) saw the biggest fertility rate drop during this period. Delaware (5.1%) and Vermont (5.0%) followed.
Full rankings
Change in fertility rates, 2022-23 (by state)
Rank | State | 2022 fertility rate | 2023 fertility rate | % change |
|---|---|---|---|---|
| 1 | Maine | 49.7 | 47.0 | -5.4% |
| 2 | Delaware | 57.3 | 54.4 | -5.1% |
| 3 | Vermont | 44.3 | 42.1 | -5.0% |
| 4 | Maryland | 56.9 | 54.1 | -4.9% |
| 5 | Rhode Island | 47.5 | 45.2 | -4.8% |
| 6 | California | 52.8 | 50.4 | -4.5% |
| 6 | Nevada | 53.2 | 50.8 | -4.5% |
| 8 | Minnesota | 58.2 | 55.7 | -4.3% |
| 9 | Hawaii | 59.3 | 56.9 | -4.0% |
| 10 | Alaska | 64.9 | 62.4 | -3.9% |
| 11 | Virginia | 55.6 | 53.6 | -3.6% |
| 11 | Washington | 53.3 | 51.4 | -3.6% |
Source: ValuePenguin analysis of CDC data. Note: The fertility rate is births per 1,000 women ages 15 to 44.
Deaths outpace births in several states
Highlighting the fertility crisis, the death rate outpaced births in 21 states in 2022 — the latest available year for both data points. Pennsylvania saw the biggest discrepancy, with 147,181 deaths and 130,252 births. That means there were 16,929 more deaths.
Florida (14,686 more deaths) and West Virginia (10,578 more) followed.
Sangameshwar says this trend could have lasting economic implications.
"Older Americans tend to have greater health care needs, including chronic disease management, hospitalizations and long-term care," she says. "An aging population will also have fewer younger, healthier individuals getting policies. With fewer young, healthy individuals to balance the costs of insuring older, higher-risk individuals, health insurance premiums will rise for all policyholders to reflect growing risk."
In addition to rising private health insurance costs, Sangameshwar notes that government health insurance programs like Medicare and Medicaid will also be affected.
Meanwhile, Texas had the biggest surplus of births, with 148,300 more than deaths. California (105,943) was the only other state with a six-figure surplus. New York (33,830) trailed in a distant third.
Full rankings
Differences in deaths/births, 2022 (by state)
Rank | State | Births | Deaths | Net change |
|---|---|---|---|---|
| 1 | Pennsylvania | 130,252 | 147,181 | -16,929 |
| 2 | Florida | 224,433 | 239,119 | -14,686 |
| 3 | West Virginia | 16,929 | 27,507 | -10,578 |
| 4 | Ohio | 128,231 | 138,209 | -9,978 |
| 5 | Michigan | 102,321 | 110,499 | -8,178 |
| 6 | Maine | 12,093 | 17,364 | -5,271 |
| 7 | Oregon | 39,493 | 44,598 | -5,105 |
| 8 | Kentucky | 52,315 | 57,053 | -4,738 |
| 9 | Alabama | 58,149 | 62,294 | -4,145 |
| 10 | Delaware | 8,075 | 11,351 | -3,276 |
| 11 | South Carolina | 57,820 | 61,052 | -3,232 |
| 12 | Mississippi | 34,675 | 37,803 | -3,128 |
Source: ValuePenguin analysis of CDC data via KFF.
Top expert tips for those considering parenthood
If you’re planning to have a child or expecting one, here are a few tips to keep in mind:
- Contact your insurer to understand how your coverage works for pregnancy. "If your plan is Affordable Care Act-compliant, it will cover your pregnancy," Sangameshwar says. "If your plan isn’t ACA-compliant (such as a short-term health plan), it may not. If that’s the case, you may be out of luck, though you can ensure you’re covered during your postpartum care. You can sign up for ACA-compliant health insurance using the special enrollment period — though you won’t qualify until the day you give birth."
- Ask about coverage for pregnancy-specific services. This includes coverage for prenatal care, delivery and postpartum care. It’s also important to find in-network providers to save money.
- Explore and enroll in secondary insurance. "Supplementary or secondary insurance (like hospitalization indemnity insurance) is meant to complement your primary plan," Sangameshwar says. "These plans are designed to cover expenses not covered by your health insurance, including hospitalization costs, ICU stays and more."
- Beef up your health savings account (HSA). If you can afford to do so, contributing extra money to HSAs and flexible spending accounts (FSAs) can help manage any out-of-pocket expenses not covered by insurance.
Methodology
ValuePenguin researchers analyzed Centers for Disease Control and Prevention (CDC) fertility rate data from 2005 through 2023. States were ranked based on percentage changes in fertility rates during this period. We also analyzed fertility rate changes between 2022 and 2023.
The fertility rate is defined as the number of births per 1,000 women ages 15 to 44.
Analysts also used CDC data compiled by KFF to compare the number of deaths to births by state in 2022 — the latest available year for both data points.
About the Author

Writer, Consumer Research
Maggie Davis is a staff writer at ValuePenguin. She primarily focuses on breaking down complex data and research about the financial lives of Americans into digestible content through our studies and surveys. Her reporting has been featured in numerous publications, such as Forbes and USA Today.
Education
- BA, Journalism, Pepperdine University
Editorial note: The content of this article is based on the author's opinions and recommendations alone. It has not been previewed, commissioned or otherwise endorsed by any of our network partners.