Homeowners Insurance
Toy Injuries Most Common Among Youngest Americans, but Decreases Provide Optimism
The fast-approaching holiday season means two things for many: time with family and new toy purchases. In fact, toys generated $28.0 billion in retail sales in 2023, according to the Toy Association. But toys, like many things, can lead to injuries — and emergency department visits.
To understand these injuries, ValuePenguin researchers examined U.S. Consumer Product Safety Commission (CPSC) National Electronic Injury Surveillance System (NEISS) data. We found toy injuries have declined in the past decade, despite recent increases.
Here’s what else we found.
On this page
Key findings
- Toy injuries have increased three years in a row, though they’re still well below prepandemic levels. 184,621 toy injuries were treated in emergency departments in 2023, up 8.3% from 2020 (164,715) but down 17.6% from 2019 (224,104). Overall, 3.6% of toy injury trips to emergency departments resulted in the victim being admitted.
- Unpowered scooters are the biggest toy injury culprit. At 322,496, they represent 15.1% of toy injuries from 2014 through 2023. Other products common in toy injuries are balls (211,400, or 9.9%) and toy vehicles (116,431, or 5.5%). In the same period, toy guns with projectiles saw a 120.2% boost.
- Children younger than 5 have accounted for almost 4 in 10 toy injuries since 2014. Over 10 years, 807,014 toy injuries (or 38.0% of the total) were to kids in this age range. Kids ages 5 to 9 (489,149, or 23.0%) and ages 10 to 14 (260,690, or 12.3%) were next. That said, toy injuries are down 6.7%, 34.3% and 49.8%, respectively, over this same period for kids younger than 5, 5 to 9 and 10 to 14.
- Nearly 1 in 5 toy injuries since 2014 were to the face. From 2014 through 2023, the face accounted for 409,000, or 18.5%, of injuries. The next closest is the head (322,639, or 14.6%). In the same period, 490,675 (or 22.0%) toy injuries resulted in lacerations, while 353,412 (or 15.9%) caused contusions or abrasions.
Toy injuries have increased in past 3 years
Toy injuries treated in U.S. emergency departments decreased by 23.3% over the past 10 years, but there’s been an 8.3% increase since 2020. In fact, injuries have increased three years in a row after declining three years in a row.
The early days of the pandemic saw the steepest decline. While 2019 saw 224,104 toy injuries, 2020 had 26.5% fewer at 164,715. This could be attributed to parents’ hesitancy to bring their children to emergency departments amid the pandemic — especially since toy sales saw continuous year-over-year increases from 2019 through 2022, per the Toy Association.
During the 10 years analyzed, there were two updates to the Toy Standard governed by the Consumer Product Safety Act (CPSA). A few notable safety changes included:
- Soaking test requirements on wooden, water and mouth-actuated toys with magnetic components
- Requirements for resilient leading edges on projectile toys
- Stability requirement clarifications on ride-on toys
Plus, Reese’s Law, which implemented a federal safety requirement around toys with button cell or coin batteries, was enacted in late 2022. (Notably, this law excluded toys for kids younger than 14 that met the preexisting Toy Standard.)
Toy injuries, 2014 to 2023 (nationally)
Year | Total injuries | Year-over-year change |
|---|---|---|
| 2014 | 240,658 | N/A |
| 2015 | 244,181 | 1.5% |
| 2016 | 239,794 | -1.8% |
| 2017 | 251,366 | 4.8% |
| 2018 | 224,704 | -10.6% |
| 2019 | 224,104 | -0.3% |
| 2020 | 164,715 | -26.5% |
| 2021 | 170,461 | 3.5% |
| 2022 | 180,953 | 6.2% |
| 2023 | 184,621 | 2.0% |
Source: ValuePenguin analysis of the National Electronic Injury Surveillance System (NEISS) database.
Over the past 10 years, men (including boys) have accounted for the majority — nearly 60.0% — of toy injuries treated in emergency room visits. This is true even as men account for only 49.5% of the U.S. population, according to the U.S. Census Bureau.
Toy injuries, 2014 to 2023 (by sex)
Sex | Total injuries | % of total injuries |
|---|---|---|
| Women | 901,841 | 42.4% |
| Men | 1,223,490 | 57.6% |
Source: ValuePenguin analysis of the NEISS database.
Notably, just 3.6% of toy-related emergency room visits during the 10 years analyzed resulted in the child being admitted. This suggests that parents, for the most part, are erring on the side of caution.
Toy injuries, 2014 to 2023 (by disposition)
Disposition | Total injuries | % of total injuries |
|---|---|---|
| Admitted to hospital | 75,608 | 3.6% |
| Not admitted to hospital | 2,049,647 | 96.4% |
Source: ValuePenguin analysis of the NEISS database.
This could be because the majority of toy-related injuries occur to the face and head — scary locations for an injury for any parent. (More on this later.)
Toy injuries and home insurance/health insurance
If someone is injured on your property, homeowners insurance and renters insurance will typically cover that injury, says Divya Sangameshwar, ValuePenguin home insurance expert. That’s because personal liability coverage is typically standard in policies.
There’s a big caveat: Liability coverage applies to guests rather than residents. That said, if you or your child are injured on someone else’s property, their personal liability coverage could apply. And your health insurance will likely still cover treatment costs, minus your deductible or coinsurance.
"If you’re planning to host parties that involve gift exchanges in your home, review the terms and conditions of your policy to determine how much liability coverage you have and what kind of injuries may be covered," Sangameshwar says. "Your insurance policy could exclude specific situations. It’s important to discuss your policy and its exclusions with your agent or insurer and look into additional coverage, like umbrella coverage, to make sure you’re protected."
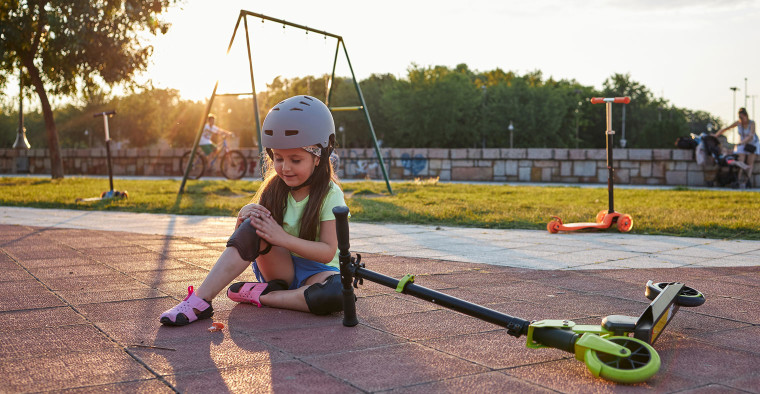
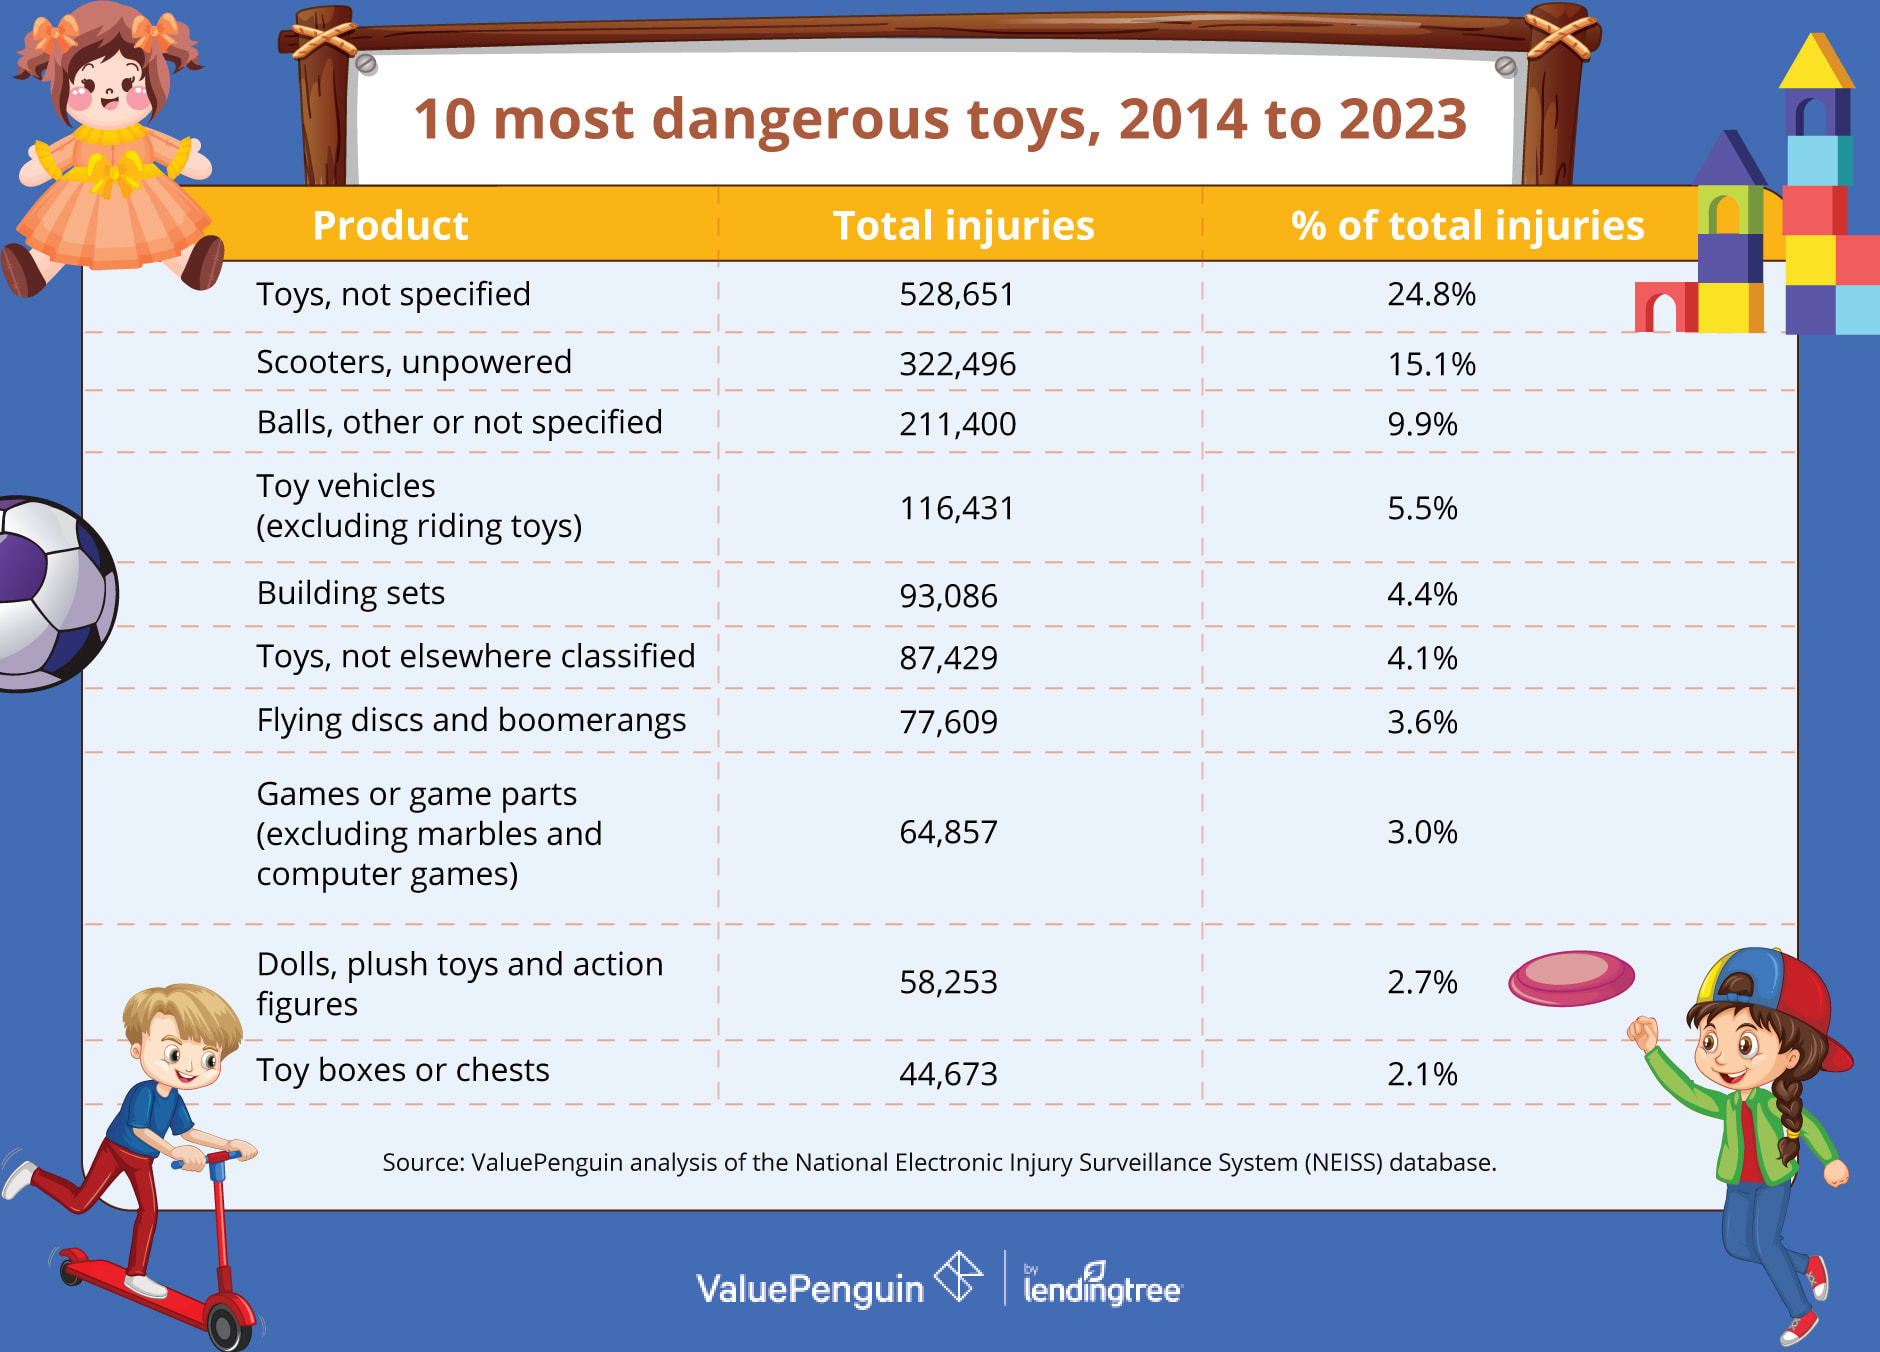
Biggest toy injury culprit: Scooters
Scooters and children seem to be a dangerous combo in the toy landscape. In fact, unpowered scooters represent 15.1% of toy injuries (or 322,496 emergency room visits) from 2014 through 2023.
It’s important to clarify NEISS coding changes on scooters. Before 2020, the NEISS used the same code for powered and unknown-if-powered scooters, making them indistinguishable. In 2020, separate codes were created, reclassifying powered scooters as sports and recreation equipment. So our tally includes unknown-if-powered numbers from the early portion of our analyzed period.
After scooters, balls (211,400, or 9.9%) and toy vehicles (116,431, or 5.5%) saw the next highest numbers of ER visits. Given that these products involve a distinct lack of stability (via a wheel or the product shape), it makes sense why these toys would be major culprits.
To give a complete look over the past 10 years, we also included toys "not specified" or "not elsewhere classified" and similar product types.
Toy injuries, 2014 to 2023 (by product)
Product | Total injuries | % of total injuries |
|---|---|---|
| Toys, not specified | 528,651 | 24.8% |
| Scooters, unpowered | 322,496 | 15.1% |
| Balls, other or not specified | 211,400 | 9.9% |
| Toy vehicles (excluding riding toys) | 116,431 | 5.5% |
| Building sets | 93,086 | 4.4% |
| Toys, not elsewhere classified | 87,429 | 4.1% |
| Flying discs and boomerangs | 77,609 | 3.6% |
| Games or game parts (excluding marbles and computer games) | 64,857 | 3.0% |
| Dolls, plush toys and action figures | 58,253 | 2.7% |
| Toy boxes or chests | 44,673 | 2.1% |
| Balloons (toy) | 39,959 | 1.9% |
| Tricycles | 39,760 | 1.9% |
Source: ValuePenguin analysis of the NEISS database. Note: The NEISS doesn’t include products when the estimate is less than 1,200.
We also looked at changes in ER toy visits over time.
The data shows some toys are becoming more dangerous. During the 10 years examined, toy guns with projectiles saw a 120.2% boost — the largest increase during this period and the only product to more than double. (Optometrists and attorneys are among the groups that often warn about toy gun injuries.)
Meanwhile, two other distinct products saw injury increases of more than 50.0%: costumes or masks and games or game parts — excluding marbles and computer games. Costumes or masks that block kids’ vision can result in falls and tumbles.
Toy injuries, 2014 to 2023 (by product over time)
Product | 2014 injuries | 2023 injuries | % change |
|---|---|---|---|
| Toy guns with projectiles | 1,642 | 3,616 | 120.2% |
| Toys, not elsewhere classified | 7,639 | 14,809 | 93.9% |
| Costumes or masks | 1,217 | 1,979 | 62.6% |
| Games or game parts (excluding marbles and computer games) | 4,712 | 7,221 | 53.2% |
| Building sets | 6,793 | 9,568 | 40.9% |
| Molding compounds | 1,901 | 2,602 | 36.9% |
| Blocks, stacking toys or pull toys | 2,239 | 2,825 | 26.2% |
| Marbles | 2,132 | 2,441 | 14.5% |
| Dolls, plush toys and action figures | 6,358 | 6,691 | 5.2% |
| Wagons (children's) | 4,120 | 4,329 | 5.1% |
| Balloons (toy) | 4,015 | 4,198 | 4.6% |
| Other toy weapons (nonprojectile) | 1,792 | 1,861 | 3.9% |
Source: ValuePenguin analysis of the NEISS database. Notes: The NEISS doesn’t include products when the estimate is less than 1,200. Products needed at least 1,200 injuries in 2014 and 2023 to be included. Unpowered scooters weren’t included because of NEISS code changes.
Children younger than 5 hurt most by toys, but kids seeing fewer injuries
The youngest age groups are most at risk for toy-related injuries. In fact, kids younger than 5 accounted for nearly 40.0% of toy injuries over the last decade — despite a slight decline in this population over the same period, via the Kids Count Data Center.
It makes sense that this age group would be susceptible to harm while playing with toys. After all, they’re still learning fine motor skills and have to be monitored closely during playtime.
As kids age, the risk of injury appears to dwindle. For example, kids ages 5 to 9 make up 23.0% of toy-related injuries, and that drops to 12.3% among those 10 to 14. This trend is nearly consistent through the oldest age group examined.
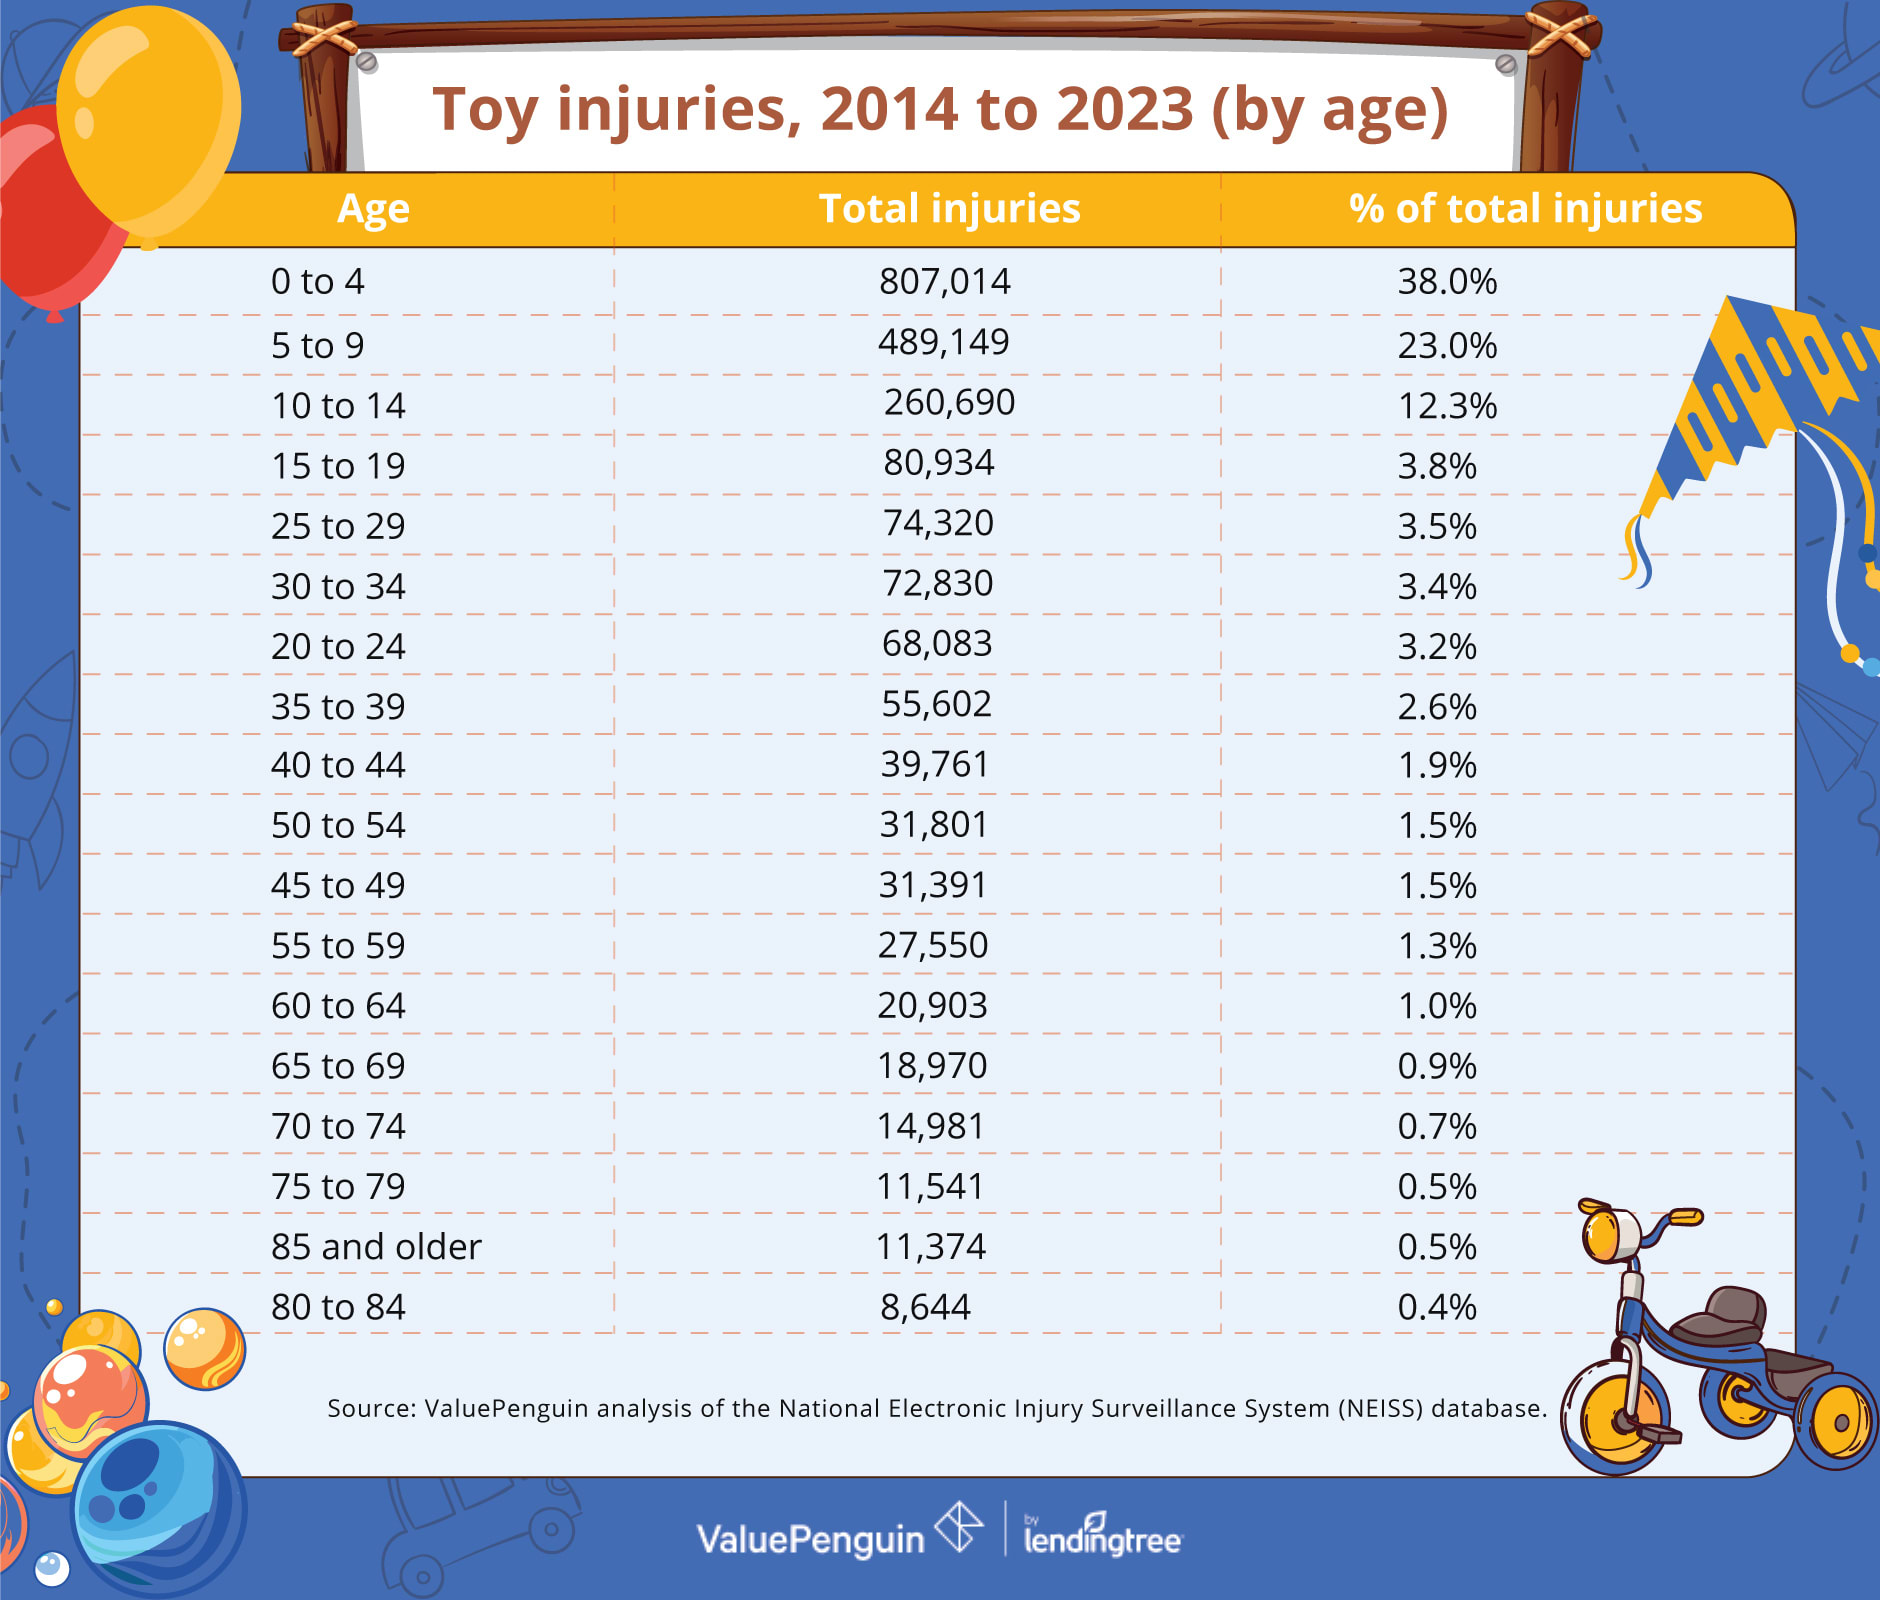
There’s encouraging data, however, when you look at toy injuries over time, especially among the youngest groups. While those younger than 5 only saw a 6.7% reduction in injuries from 2014 through 2023, those 5 to 9 and 10 to 14 had reductions of more than 33.0%.
Toy injuries, 2014 to 2023 (by age over time among youngest Americans)
Age | 2014 injuries | 2023 injuries | % change |
|---|---|---|---|
| 10 to 14 | 33,749 | 16,946 | -49.8% |
| 5 to 9 | 61,931 | 40,704 | -34.3% |
| 0 to 4 | 83,728 | 78,130 | -6.7% |
Source: ValuePenguin analysis of the NEISS database.
"This is a sign that there’s better communication around toy safety by toy manufacturers, retailers and the CPSA, allowing Americans to make more informed choices around the toys they buy for children and avoid potentially dangerous toys for their little ones," Sangameshwar says.
She attributes this progress to the 100-plus toy safety regulations, tests and requirements designed to protect children at play. She also cites another common theme at play.
"Of course, I can’t discount the impact of screens — more and more children are finding the enrichment and entertainment they need from mobile devices and prefer them over traditional toys," Sangameshwar says. "While screens aren’t entirely without danger, they’re devices that encourage sedentary play and fewer physical injuries."
Most commonly injured body parts: Face, head
Toy-related injuries are most likely to occur to the face (18.5%) or head (14.6%).
Combined, that’s about one-third of related injuries from 2014 through 2023. This aligns with falls being one of the common reasons behind head injuries in children.
Meanwhile, every other body part tracked accounted for less than 10.0% of total injuries.
Toy injuries, 2014 to 2023 (by body part)
Body part | Total injuries | % of total injuries |
|---|---|---|
| Face | 409,000 | 18.5% |
| Head | 322,639 | 14.6% |
| Internal | 155,474 | 7.0% |
| Mouth | 122,619 | 5.5% |
| Finger | 114,308 | 5.2% |
| Eyeball | 96,822 | 4.4% |
| Foot | 90,277 | 4.1% |
| Ankle | 86,481 | 3.9% |
| Wrist | 79,677 | 3.6% |
| Lower arm | 78,705 | 3.6% |
| Lower trunk | 77,211 | 3.5% |
| Ear | 74,195 | 3.4% |
Source: ValuePenguin analysis of the NEISS database.
Most common diagnoses: Lacerations, contusions/abrasions
When kids get hurt by a toy, the most common injuries are cuts (accounting for 22.0% over the past decade) and scrapes or bruises (15.9%).
Cuts and scrapes were also the most common diagnoses in toy injuries nearly 30 years ago (in 1996), according to a Centers for Disease Control and Prevention (CDC) analysis of NEISS data.
Toy injuries, 2014 to 2023 (by diagnosis)
Diagnosis | Total injuries | % of total injuries |
|---|---|---|
| Laceration | 490,675 | 22.0% |
| Contusions, abrasions | 353,412 | 15.9% |
| Other | 252,023 | 11.3% |
| Fracture | 241,268 | 10.8% |
| Internal organ injury | 189,271 | 8.5% |
| Strain, sprain | 183,643 | 8.2% |
| Foreign body | 174,679 | 7.8% |
| Aspiration/ingestion | 155,474 | 7.0% |
| Concussion | 33,354 | 1.5% |
| Dislocation | 27,473 | 1.2% |
| Hematoma | 25,049 | 1.1% |
| Dental injury | 21,944 | 1.0% |
Source: ValuePenguin analysis of the NEISS database. Note: The NEISS doesn’t include categories when the estimate is less than 1,200.
5 things to do when your child is hurt by a toy
It can be difficult to know what to do when your child is injured. Once you’ve made sure they get the proper care, here are five steps you can take to make sure a toy-related injury doesn’t take a toll on your finances:
- Use your health insurance. If you have health insurance coverage, that’ll likely help cover the costs of treating your child’s injuries, even if they happen at your home. Just keep in mind that this kicks in after your deductible, and you may have to pay a copay for the visit. And there can be coverage exceptions.
- Stick to in-network hospitals. "It can become a very expensive injury if you take your child to an out-of-network emergency room or urgent care," Sangameshwar says. "It’s important to make sure you have a list of in-network ERs and urgent care clinics nearby so you don’t need to scramble for this information when dealing with a crisis."
- Carefully consider your mode of transportation. Ambulance rides can be extremely expensive, but they’re warranted and necessary in serious situations. Before you make a 911 call, you may want to consider taking your car instead. Or, if your health insurance offers it, you might consider a telehealth check-in to see if a hospital visit is warranted.
- Look into other health plans. "If you have the budget for it, opt for a health plan with better coverage, and also supplementary insurance for accidents, injuries and hospitalization, which will cover costs that your health insurance won’t cover," Sangameshwar says. "Robust insurance coverage will protect you from a huge, unwanted medical bill from a toy injury."
- Stay informed. Toy recalls aren’t the norm, but they happen. It’s vital for parents to keep an eye out for recalls. Those can be found on the CPSC’s website, where you can also sign up for email notifications of recalls.
Methodology
ValuePenguin researchers analyzed data from the National Electronic Injury Surveillance System (NEISS) — available through the U.S. Consumer Product Safety Commission (CPSC) — to determine the number of toy injuries treated in emergency departments.
Researchers examined various periods between 2014 and 2023, breaking down the data by year, sex, disposition, product, age, body part and diagnosis.
Note that the NEISS doesn’t include specific breakdowns in a given period when the estimate is less than 1,200.