Health Insurance
Majority of Americans Don’t Get Flu Vaccine, but No Significant Dips Seen in States With COVID-19 Vaccine Doubts
Amid the race for the first COVID-19 vaccine in the US, ValuePenguin analyzed Centers for Disease Control and Prevention (CDC) data to try to understand where people are most and least likely to get inoculated.
One in five respondents in two regions in the South told ValuePenguin in July 2020 that they wouldn't accept a COVID-19 vaccine once one was released. But in many of those states, the rate at which people get the influenza vaccine is higher than the national average.
From 2010–11 to 2018–19, only 45% of Americans on average were vaccinated against the seasonal flu. That's well below the federal government's target threshold of 70%.
Key findings
- While the CDC recommends that people 6 months and older get inoculated against the seasonal flu, many won't. From the 2010–11 flu season to the 2018–19 flu season, an average of 55% of people didn't get the flu vaccine.
-
Though 14% previously told ValuePenguin that they wouldn't get vaccinated against COVID-19, places where many have doubts about vaccines have consistently average flu vaccination rates.
-
In the states where COVID-19 has had the highest average rates of transmission, the flu vaccination rate was slightly lower than the national average in the 2018–19 season.
-
In most states, schoolchildren are required to get certain vaccines, including measles, mumps and rubella (MMR). But since the 2014–15 school year, the percentage of exemptions has increased from 1.8% to 2.6%.
Despite CDC recommendations, 55% of Americans don't get vaccinated against the seasonal flu
Many Americans aren't required to get the flu vaccine. The flu vaccination rate has risen, from 43% in 2010–11 to 49% in 2018–19. During this time span, an average of 45% of Americans were vaccinated yearly.

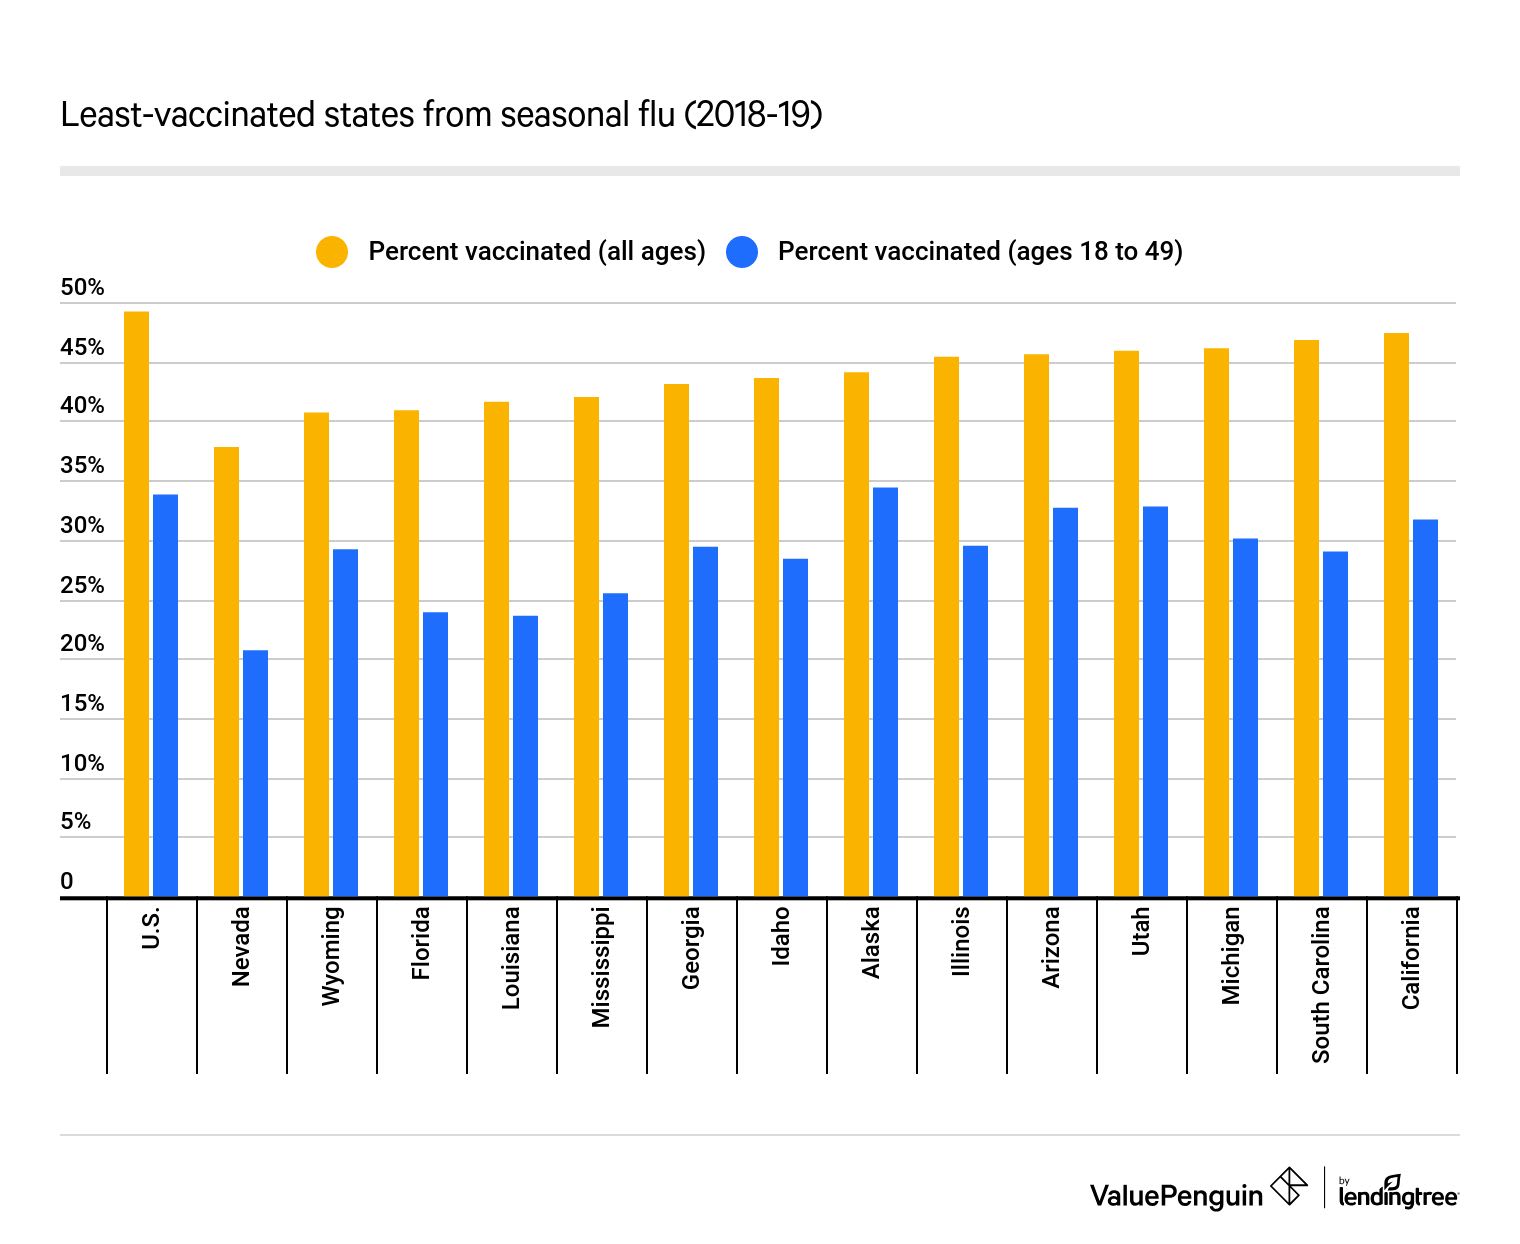
In the 2018–19 flu season, the CDC estimated that Nevada had the lowest vaccination rate among the US states. Only 37.8% of people there got the flu vaccine, making it the only state with a vaccination rate below 40%. Of note, just 20.7% of people ages 18 to 49 in Nevada were vaccinated against the flu — also the lowest.
After Nevada, a number of the lowest vaccination rates are in the South: Four of the 10 least-vaccinated states were Florida, Georgia, Louisiana and Mississippi. In Mississippi, which had the lowest percentage of vaccine exemptions, only 42% of people voluntarily got the flu shot in 2018, the fourth-lowest rate.
On the reverse side, Rhode Island had the largest share — 60.4% — of its population vaccinated against the seasonal flu. New England had a few of the most vaccinated states, as Massachusetts followed Rhode Island with a rate of 58.9%. Connecticut was close behind at 56.8%.
The youngest and oldest Americans are most likely to get vaccinated against the flu. The CDC reported that about 68% of people 65 and older and nearly 63% of people 17 and younger were vaccinated against the flu in 2018–19. Conversely, 18- to 49-year-olds were least likely to get the shot. Even among high-risk individuals ages 18 to 49 — with asthma, diabetes, heart disease, cancer or other potentially complicating preexisting conditions — the vaccination rate was only 40%.
Percentage of people who got the flu vaccine in 2018–19
People are generally receptive to getting vaccinated where COVID-19 has been the most transmissible
The opinions that Americans have regarding getting vaccinated could provide clues about how the public would receive a COVID-19 vaccine. In a survey conducted summer 2020, ValuePenguin found that 36% of people said they were going to get the coronavirus vaccine when it came out, no matter what. However, about 14% said they wouldn't get vaccinated under any circumstances. Almost 10% said they wouldn't vaccinate their kids.
Who pays for a COVID-19 vaccine? The federal government has stated that insurance companies will pay for a COVID-19 immunization once it's available, meaning it will be free to those who want it and have health insurance. However, if that doesn't happen, any copayment would have to be established by private health insurance companies and federal programs, such as Medicare and Medicaid. Right now, the latter two only explicitly pay for certain necessary vaccines.
The pushback against a COVID-19 vaccine was highest in two Southern regions, one of which was the group of states consisting of Alabama, Kentucky, Mississippi and Tennessee. Here, one in five said they wouldn't get vaccinated against COVID-19, while 19% wouldn't inoculate their kids.
Furthermore, in the regions of Delaware, Florida, Georgia, Maryland, North Carolina, South Carolina, Virginia and West Virginia, an average of 49.6% of people were vaccinated against the flu during the 2018–19 season. This is nearly equal to the percentage of people the CDC estimated were vaccinated nationwide during the same time: 49%. Even where there's a degree of skepticism about vaccines, the percentage of people getting vaccinated voluntarily in these states isn't an outlier, compared with the rest of the country.

These states had the highest average COVID-19 transmission rates from March to August
Additionally, inoculation rates have remained in alignment with national expectations in the states where COVID-19 has been the most transmissive. From March to September, Florida, Illinois, Indiana, Kentucky and Texas had the highest average rates of transmission, according to Rt.live, a model that measures how quickly the virus spreads. In these states, though, more than 46% of people in 2018–19 were vaccinated for the flu.
But the percentage of people who get the flu vaccine voluntarily, especially compared with those who get mandatory shots, is nowhere near the 70% threshold the federal government targets. In Rhode Island, which comes closest to this mark, only 60.4% of residents were vaccinated in 2018–19. A COVID-19 vaccine may take a long time to immunize the public against the disease unless the vaccination rate rises.
Vaccine exemptions for schoolchildren have increased since 2014–15, but so have measures combating nonmedical opt-outs
Since the 2014–15 school year, the percentage of exemptions among kindergartners has increased each year. The CDC reported that 1.8% of the estimated population of 3.7 million kindergartners were exempted in 2014 for medical or nonmedical reasons. This number rose to 2.6% of 4 million in 2018.
In the majority of states, schoolchildren are required to get vaccinated against a score of diseases, such as:
- Chicken pox
- Diphtheria, tetanus and pertussis (DTaP)
- Measles, mumps and rubella (MMR)
A complete vaccination record is a prerequisite for attending public school or day care in many states. However, compliance isn't universal.
In more than half of all states, children can attend school unvaccinated with a grace period, often set at 30 days. For example, the CDC estimated that in the 2017–18 school year, about 2% of kids entered school under a grace period. School staff and nurses are tasked with following up with parents or guardians of unvaccinated children to ensure compliance with the requirements. In other cases, there are a number of exemptions that parents can invoke to avoid getting their children vaccinated.
Children with preexisting conditions that don't allow them to get a vaccine safely may be eligible for a medical exemption. Parents may also get a nonmedical exemption. Forty-five states and the District of Columbia allow for religious exemptions from vaccines, while 15 allow parents to claim philosophical exemptions from vaccines in public schools.
Due to measles outbreaks, states have been moving to restrict nonmedical exemptions. In 2019, Maine, New York and Washington passed legislation restricting some types of opt-outs.
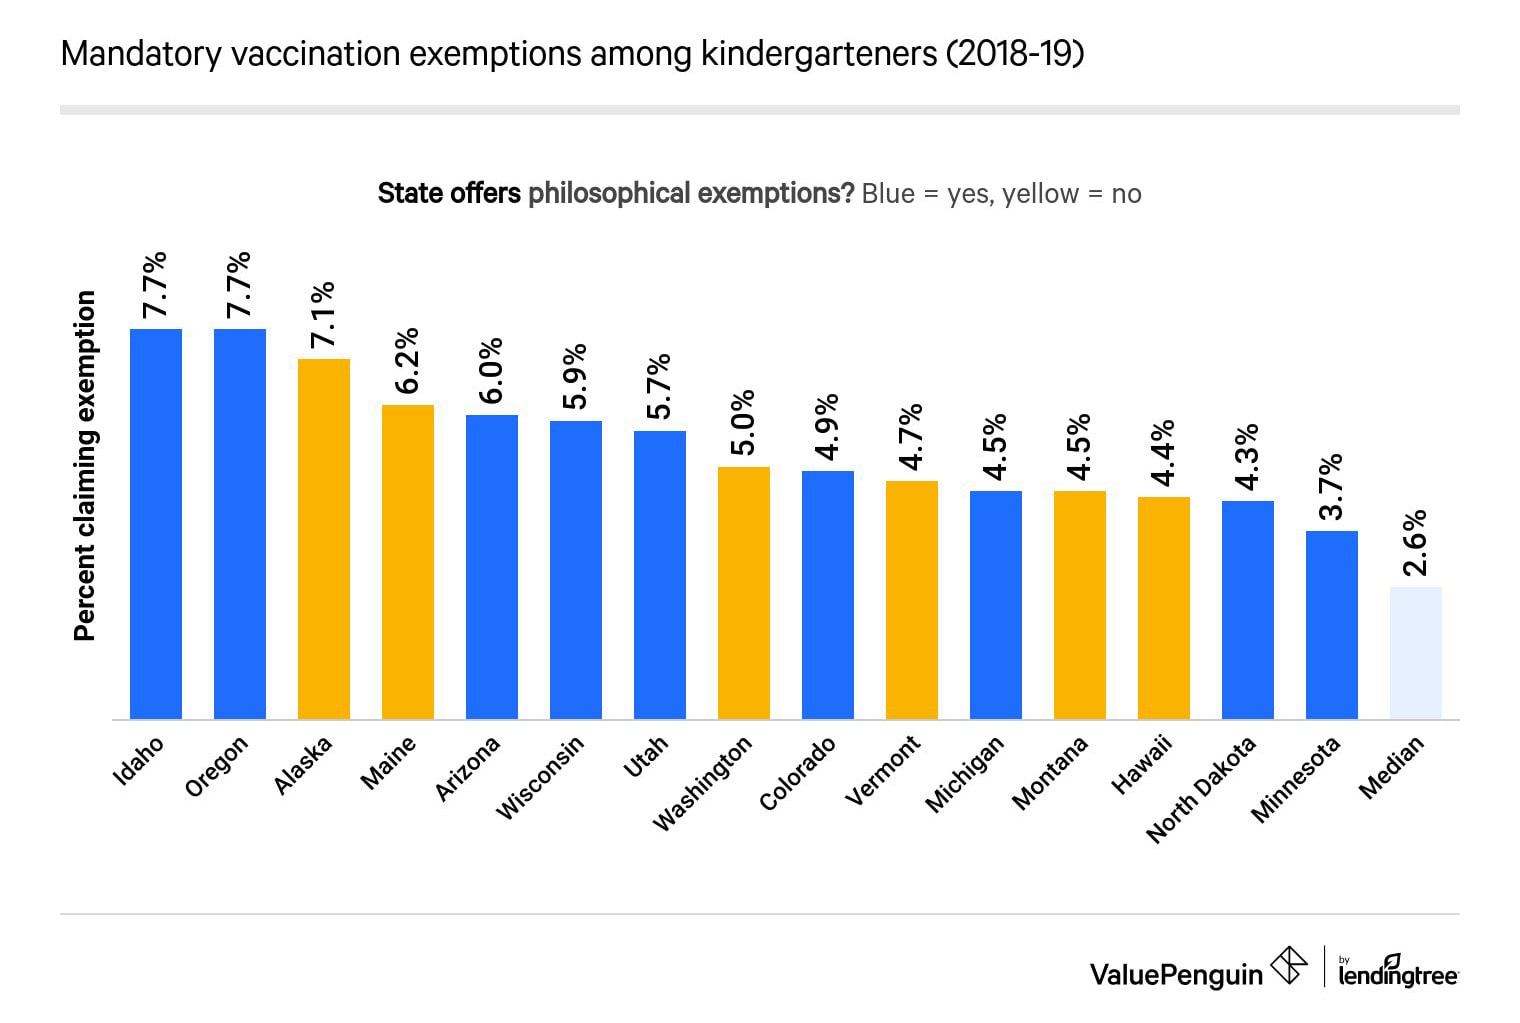
Idaho and Oregon had the highest percentage of exemptions among kindergartners, with both states recording opt-outs at 7.7%. A significant portion of the states — seven out of 10 — where exemptions were high are in the West.
Conversely, Mississippi (0.1%) had the lowest percentage of opt-outs in the 2018–19 school year. Many Southern states, including Alabama (0.8%), West Virginia (0.8%), Louisiana (1.2%), Kentucky (1.4%) and Tennessee (1.9%), posted low exemption rates. These states averaged an exemption rate of only 1.22% — more than one percentage point lower than the national median.
Methodology
Data on vaccination rates and mandatory and voluntary vaccinations come from the CDC. ValuePenguin calculated the average rate of transmission of COVID-19 in each of the country's states using Rt.live. ValuePenguin gathered transmission figures from March to August 2020, averaged the numbers and organized the data by state.
About the Author

Insurance Research Analyst
Andrew Hurst is a former SEO Marketing Research Analyst at ValuePenguin who reported on insurance. His analysis has been featured in the New York Times, Wall Street Journal, NPR Marketplace, Forbes, MSN, and USA News — among others. He's also appeared in interviews broadcast by ABC, FOX, CBS and NBC stations. He previously taught composition and research at Wright State University.