States Most At Risk for Natural Disasters
As the United States enters its peak severe weather season, residents of some states are more likely than others to experience natural disasters and the subsequent financial fallout. We found that 10 U.S. states bear more than 80% of the national cost of natural disasters, with damage concentrated along the Gulf Coast.
This year is also on pace to have the most federally declared disasters in history. By the end of April, 2020 was already ranked number two, with peak hurricane and wildfire season yet to come.
Key takeaways:
1. Texas experiences the biggest financial fallout from natural disasters, with annual costs averaging $1,478 per household over the last five years.
2.Ten U.S. states have footed the bill for 80% of total disaster costs since 2014.
3. Hurricanes and flooding are the key causes of damage, but wildfires made a bigger impact over the last five years than before that period.
4. As a result of the coronavirus, 2020 is on pace to be the most disaster-heavy year on record. As of June 1, FEMA has declared more disasters this year than any other except for all of 2011.
Top 10 states at risk for natural disasters


1. Texas
- $1,476 projected annual property damage cost per household
- $14.1B statewide annual property damage
The lengthy Gulf Coast shoreline puts Texas at the highest risk of natural disaster. In 2017 alone, the state sustained a staggering $63.4 billion in damage, primarily due to Hurricane Harvey.
Over the last five years, the Lone Star state has sustained an average of $14.1 billion in annual disaster damage, amounting to an average expense of $1,476 per household every year. Texas also had the most fatalities during this five-year period; 321 people died in weather-related disasters.
2. Louisiana
- $1,078 projected annual property damage cost per household
- $1.87B statewide annual property damage
Like Texas, Louisiana's position near the Gulf of Mexico makes it highly susceptible to hurricanes and severe rainstorms. Between 2014 and 2018, disaster damage cost households $1,078 on average per year. Two of the state's major cities — New Orleans and Baton Rouge — are also located along the Mississippi River delta, making them common targets of flooding.
3. Florida
- $451 projected annual property damage cost per household
- $3.44B statewide annual property damage
Florida has the longest coastline of any state in the continental U.S., so it's no surprise it’s among the most vulnerable to severe storms. The average cost of disasters has been $451 per year for every household, over the last five years. Hurricane Michael made 2018 an especially costly year for Florida, with $9.9 billion in damage across the state.
4. California
- $319 projected annual property damage cost per household
- $4.14B statewide annual property damage
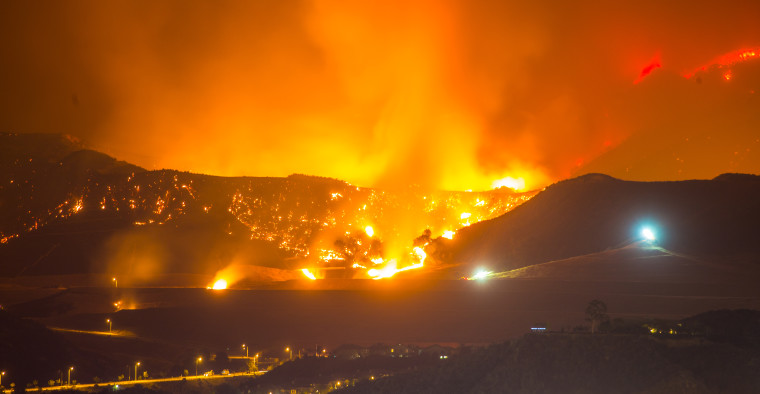
California residents incur $4.14 billion in property damage every year, which breaks down to about $319 per household, and California has the highest incidence of major disasters when not counting hurricanes and rainstorms. Wildfires contributed the most damage in California — especially in 2018, when the Camp and Woolsey fires occurred.
California has also had the greatest number of FEMA-declared disasters of any state: an average of 16.4 disasters per year between 2014 and 2018.
5. Colorado
- $220 projected annual property damage cost per household
- $464M statewide annual property damage
Colorado households incur $220 in property damage each year, on average, which works out to $464 million statewide. Colorado's costliest year was 2017, mostly due to the largest hailstorm in state history. On May 8, baseball-sized hail hit the West Denver area during the evening commute, causing $2.3 billion in home and automobile damage.
Not every homeowner or car owner needs insurance coverage for hail, but hail damage is covered under most homeowners insurance policies, and comprehensive coverage for most cars.
6. North Carolina
- $153 projected annual property damage cost per household
- $600M statewide annual property damage
The Tar Heel State has a lengthy Atlantic coastline, which is hit by an average of 2.4 hurricanes and tropical storms each year. That's resulted in $600 million of damage statewide per year, though Hurricane Florence alone contributed to $2 billion of damage in 2018. There are also about 96 fatalities per year in North Carolina due to major disasters.
7. Michigan
- $150 projected annual property damage cost per household
- $586M statewide annual property damage
Unlike most states on our list, Michigan isn't located along an ocean — nor is it a Southern state. Nevertheless, it experiences an average of $586 million in disaster damage each year, largely due to rainstorms, flooding and tornadoes. 2014 was a particularly costly year for Michigan, with storms causing $1.9 billion in property damage, and 16 deaths were caused by disasters between 2014 and 2018.
8. New Mexico
- $119 projected annual property damage cost per household
- $93M statewide annual property damage
While New Mexico doesn't experience coastal storms like its neighbor Texas, it's still the site of smaller-yet--costly natural disasters, such as flooding and wildfires — including the Ghost Ranch Flood of 2015. New Mexico households incur an average of $119 in property damage per year, totalling $93 million state-wide.
9. Nebraska
- $115 projected annual property damage cost per household
- $87M statewide annual property damage
Located near the center of Tornado Alley, Nebraska incurs an average of $87 million in property damage each year — or about $115 per household. The National Weather Service says about 53 tornadoes pass through Nebraska each year. These natural disasters can cause severe wind, rain and hail damage.
10. Georgia
- $112 projected annual property damage cost per household
- $415M statewide annual property damage
Despite its location next to Florida, and along the Atlantic coast, Georgia has experienced relatively little damage on a per-household basis over the past five years. The typical cost of disaster damage for a Georgia household is just $112 annually. However, 2017 was a costly year for this state, with Tropical Storm Irma causing $1.5 billion in damage.
2020 is on track to have the most FEMA disasters on record
Just five months in, 2020 is on track to have the highest number of FEMA-recognized (Federal Emergency Management Agency) disasters in history. Declaring a disaster is key in helping states recover, as it allows them to receive additional federal aid.
While most disasters address by FEMA involve natural events, like hurricanes and earthquakes, FEMA defines a natural disaster more widely as "[a]n occurrence of a natural catastrophe, technological accident, or human-caused event that has resulted in severe property damage, deaths, and/or multiple injuries." Using that definition, FEMA has declared 180 year-to-date disasters as of the end of May, with 154 of those relating to the coronavirus.
While the full cost of the coronavirus will be impossible to determine until the virus is under control, but it will likely be among the costliest disasters in U.S. history. With a $2.2 trillion price tag, the CARES Act alone is one of the costliest relief efforts ever passed by the federal government.
Furthermore, peak disaster season is yet to come. Between 1998 and 2019, the summer months of June, July and August accounted for 51% of disasters, mostly consisting of hurricanes and rainstorms.
How to protect your property from natural disasters
While it's impossible to predict exactly when a natural disaster will strike, the good news is that it's often easy to protect yourself from one of these events.
No matter what type of disaster you're facing, one of the best defenses is get home insurance for severe weather events. Homeowners should review their coverage at least once every two years, and every time they move, grow their family, get a pet or renovate their home.
Be sure to double-check that you have enough dwelling and property coverage to fully protect everything you own, and consider replacement-cost coverage if you can afford it.
Next, check to see if your home is at risk for any major disasters, and be sure to get adequate coverage. You probably already know if you're susceptible to floods, coastal storms, wind or earthquakes, but it doesn't hurt to confirm. Many disaster types are not usually covered under regular insurance, like flooding, earthquakes and volcanoes, and depending on where you live, wind and wildfire damage might not be, either.
Flooding in particular is important to consider, as flood maps are updated periodically and your home may be in more danger now than when you bought it. If you live in a Special Flood Hazard Area (SFHA), you might be required to have flood insurance as a term of your mortgage.
National rankings of states most at risk for major disasters
We found that states most at risk for natural disasters are generally concentrated near the Gulf of Mexico, an area subjected to many serious storms over the last five years.
Surprisingly, many of the states that experienced the least damage are along the Northeastern corridor. Although the area was hit hard in 2012 by Superstorm Sandy, the past several years have been comparatively calm.
Cost rank | State | Average number of FEMA disasters (2014–2018) | Cost per household annually |
|---|---|---|---|
| 1 | Texas | 3.2 | $1,476 |
| 2 | Louisiana | 1.6 | $1,078 |
| 3 | Florida | 2.4 | $451 |
| 4 | California | 16.4 | $319 |
| 5 | Colorado | 1.4 | $220 |
| 6 | North Carolina | 1.6 | $153 |
| 7 | Michigan | 0.8 | $150 |
| 8 | New Mexico | 1.4 | $119 |
| 9 | Nebraska | 1.6 | $115 |
| 10 | Georgia | 2.8 | $112 |
| 11 | North Dakota | 0.4 | $96 |
| 12 | Iowa | 1.8 | $90 |
| 13 | Idaho | 2.4 | $75 |
| 14 | Mississippi | 1.6 | $64 |
| 15 | Arkansas | 1.2 | $62 |
| 16 | West Virginia | 2.0 | $59 |
| 17 | South Carolina | 2.2 | $45 |
| 18 | Washington | 9.2 | $42 |
| 19 | Oklahoma | 4.0 | $39 |
| 20 | Kansas | 3.0 | $32 |
| 21 | Wisconsin | 1.0 | $31 |
| 22 | Alaska | 2.0 | $29 |
| 23 | Vermont | 1.4 | $26 |
| 24 | Nevada | 2.2 | $25 |
| 25 | Wyoming | 1.6 | $25 |
| 26 | South Dakota | 1.0 | $24 |
| 27 | Illinois | 0.0 | $23 |
| 28 | Missouri | 1.0 | $22 |
| 29 | Utah | 1.6 | $22 |
| 30 | Oregon | 5.4 | $17 |
| 31 | Tennessee | 1.8 | $16 |
| 32 | Virginia | 1.0 | $15 |
| 33 | Hawaii | 1.6 | $13 |
| 34 | Minnesota | 0.6 | $12 |
| 35 | Kentucky | 2.0 | $12 |
| 36 | Montana | 3.0 | $11 |
| 37 | Alabama | 1.6 | $10 |
| 38 | Ohio | 0.2 | $10 |
| 39 | Arizona | 2.0 | $10 |
| 40 | Indiana | 0.4 | $10 |
| 41 | Maryland | 1.0 | $10 |
| 42 | New Hampshire | 1.4 | $9 |
| 43 | Pennsylvania | 0.8 | $7 |
| 44 | New York | 1.0 | $6 |
| 45 | New Jersey | 0.6 | $6 |
| 46 | Maine | 0.6 | $5 |
| 47 | Massachusetts | 0.6 | $3 |
| 48 | Connecticut | 0.6 | $2 |
| 49 | Rhode Island | 0.2 | $1 |
| 50 | Delaware | 0.2 | $1 |
Methodology
We determined the cost and frequency of natural disasters by analyzing the National Weather Service's annual nationwide reports of disaster damage by state between 2014 and 2018, the latest year for which data is available, and cross-referenced this with U.S. Census population data to determine costs by household. We also compiled FEMA disaster declarations through May 2020 to understand where disasters are occurring most frequently.
About the Author

Lead Writer
Matt Timmons is a Lead Writer on the insurance team at ValuePenguin, where he writes in-depth and timely pieces helping find the right coverage for them.
He's covered insurance at ValuePenguin since 2018, specializing in auto and home insurance, as well as life insurance. He's paid special attention to the EV insurance market, where prices are much higher than for gas cars.
Before he started writing about personal finance, Matt wrote about professional skills and online tools at an e-learning company.
How insurance helped Matt
During freshman orientation in college, Matt's iPod was stolen off his table while he was eating lunch. Luckily, he'd bought a college insurance plan the day before and he had money to buy a replacement before classes started.
Expertise
- Auto insurance
- Home insurance
- Insurance rate analysis
- Life insurance
Referenced by
- CNBC
- Miami Herald
- Yahoo! Finance
Education
- BA, Wesleyan University
Editorial Note: The content of this article is based on the author's opinions and recommendations alone. It has not been previewed, commissioned or otherwise endorsed by any of our network partners.