Heat Waves Surge 4 Times Higher Than 6 Decades Ago

Summer may be in full swing, but the hottest day of the year in many places isn’t until August or even October. And if it feels like it’s getting hotter, you’re not alone: The average number of heat wave days per year is four times higher than it was six decades ago, according to our analysis.
Here’s a closer look at where heat waves are rising the most, as well as heat-related emergency visits. You'll want to consider what these trends could mean for your health insurance, too.
On this page
Key findings
- The average number of heat wave days is four times higher than it was six decades ago. Across the largest metros with available data, the average number of days under heat waves rose from 6.5 a year in the 1960s to 27.1 in the 2020s. That means the average went from less than a week to nearly a full month. The number of annual heat waves has also nearly tripled from 2.2 a year to 6.3 on average.
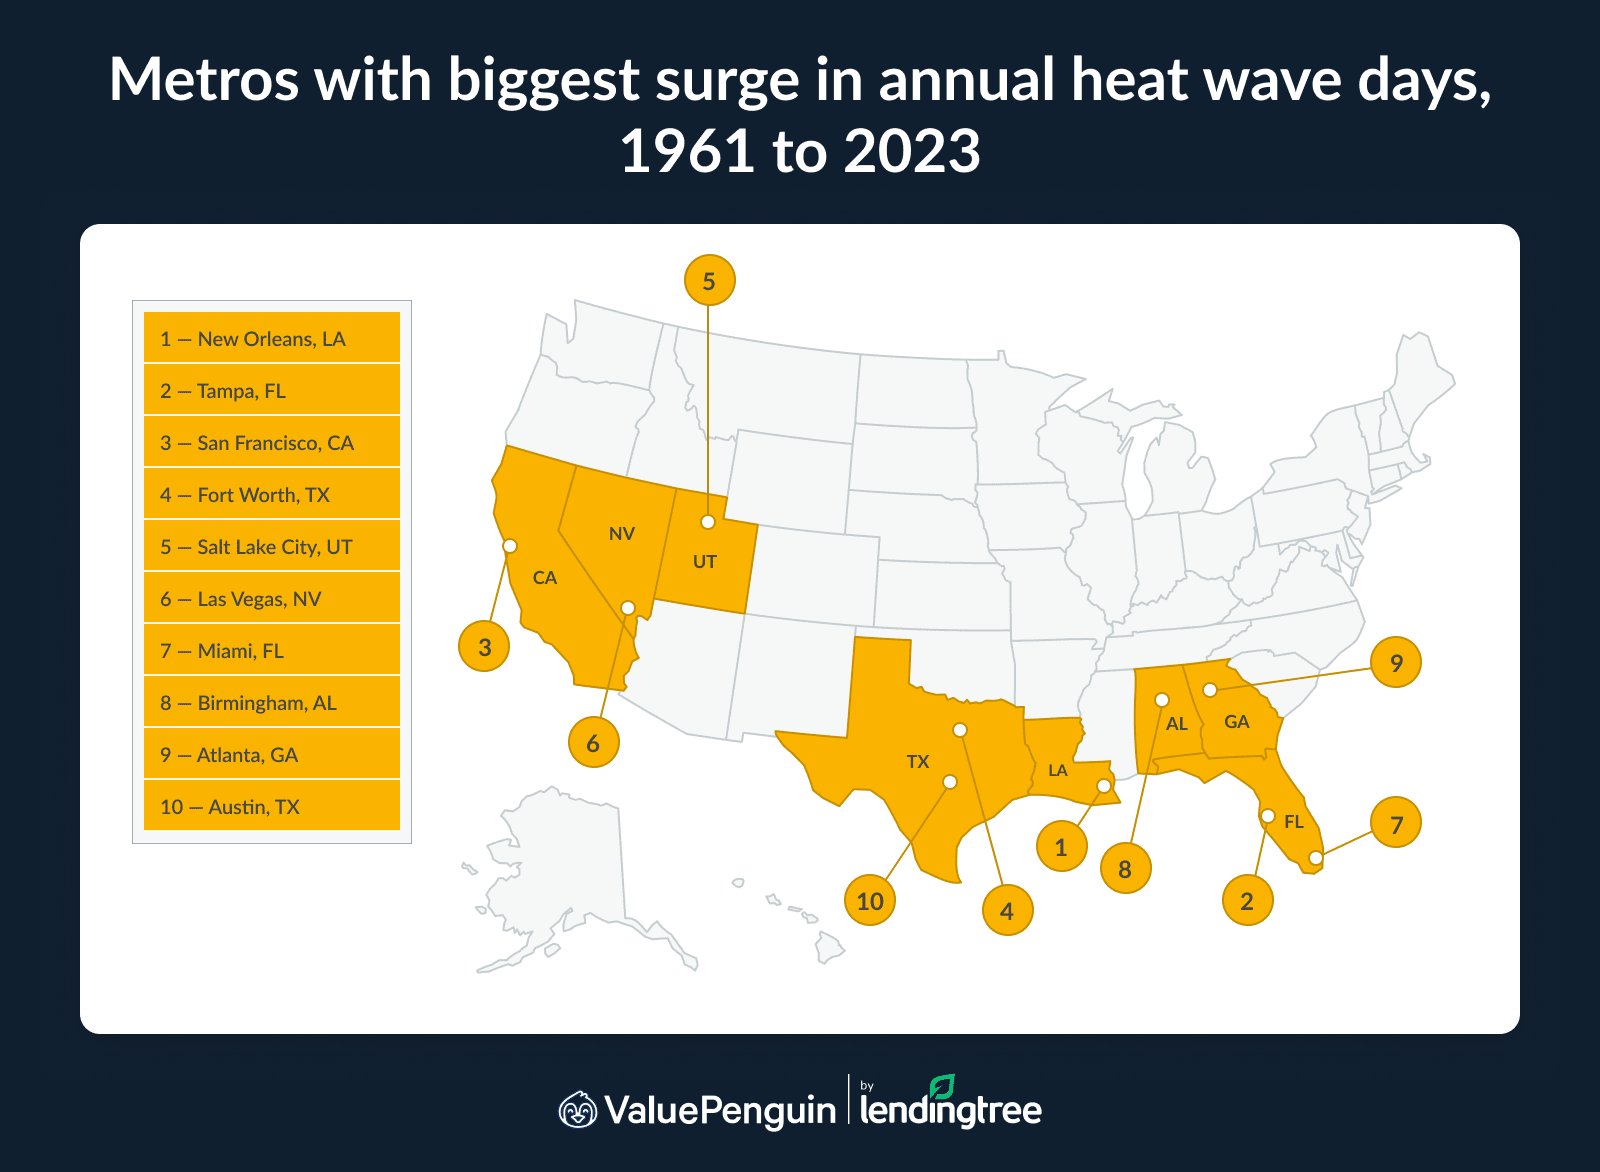
- New Orleans has experienced the biggest surge in annual heat wave days (rising by 40.8 days), ahead of Tampa, Fla. (25.4), and San Francisco (22.5). Meanwhile, five metros experienced slight declines in annual heat wave days between 1961 and 2023. Separately, every analyzed metro saw an increase in heat wave events. Tampa leads with 10.4 additional heat waves a year, ahead of Miami (9.7) and New Orleans (9.1).
- Heat-related emergency department (ED) visits have increased nationwide each summer since 2020. From June to August 2024, 286.3 Americans per 100,000 ED visits went for heat-related conditions — a 41.4% increase from summer 2020. Four U.S. regions saw an increase of over 50.0% during this time, with the foursome of Alaska, Idaho, Oregon and Washington jumping the most at 76.3%.
- Heat has caused more deaths over the past 30 years than flooding or tornadoes, with 5,971 fatalities. Heat-related deaths averaged 199 a year from 1995 to 2024. That’s significantly higher than average annual deaths related to flooding (89), tornadoes (72) and hurricanes (51). The worst years for heat-related deaths in the analyzed period were 1995, with 1,021, and 2023, with 555.
Heat wave days have risen dramatically
The average number of heat wave days — calculated by multiplying the average number of heat waves per year by the average length of individual heat waves in days — has risen dramatically over time.
Across the largest metros with available data, the average number of days under heat waves was 6.5 a year in the 1960s. That’s risen by more than four times to 27.1 in the 2020s. (Note: 2020s data, per the Environmental Protection Agency, or EPA, is through 2023.)
To put that into perspective, the average went from less than a week to nearly a full month.
Note: Key large metros — such as New York, Houston, Washington, D.C., and Minneapolis — were excluded by the EPA because of data or station issues.
Separately, the number of annual heat waves has also risen dramatically, from an average of 2.2 a year in the 1960s to 6.3 in the 2020s.

Heat waves by decade across most populous metros
Decade | Avg. # of heat waves per year | Avg. length of heat waves in days | Annual heat wave days per year | Avg. length of annual heat wave season in days | Avg. temp above local threshold during heat waves |
|---|---|---|---|---|---|
| 2020s | 6.3 | 4.3 | 27.1 | 69.9 | 2.5 |
| 2010s | 6.0 | 4.0 | 24.1 | 68.5 | 2.4 |
| 2000s | 4.7 | 3.7 | 17.1 | 53.5 | 2.3 |
| 1990s | 4.0 | 3.5 | 13.7 | 47.5 | 2.3 |
| 1980s | 3.2 | 3.3 | 10.6 | 38.8 | 2.2 |
| 1970s | 2.8 | 3.2 | 9.1 | 34.0 | 2.1 |
| 1960s | 2.2 | 3.0 | 6.5 | 23.8 | 1.9 |
Source: ValuePenguin analysis of Environmental Protection Agency (EPA) data across the largest metros with available data. Note: The 1960s data represents the average from 1961 to 1970, the 1970s are 1971 to 1980 and so on. The 2020s are a partial decade, reflecting 2021 to 2023.
ValuePenguin health insurance expert Divya Sangameshwar says the data paints a clear picture of climate change’s impact.
"It also reflects changes to land use across the U.S., which has led to the creation of urban heat islands," she says. "The increase in extreme heat across the U.S. highlights the urgent need to reduce emissions, improve urban planning and increase green infrastructure."
New Orleans saw the biggest change in annual heat wave days
By metro, New Orleans has experienced the biggest surge in annual heat wave days, rising by an additional 40.8 days. (We calculated this by multiplying the change in the number of heat waves between 1961 and 2023 by the change in the length of individual heat waves in days.) Tampa, Fla. (25.4), and San Francisco (22.5) follow.
Meanwhile, five metros experienced slight declines in annual heat wave days between 1961 and 2023:
- Memphis, Tenn. (2.1 days decrease)
- St. Louis, Mo. (1.7)
- Rochester, N.Y. (0.3)
- San Diego (0.1)
- Chicago (0.1)
Separately, every analyzed metro saw an increase in heat wave events. Tampa leads with 10.4 additional heat waves a year. Miami (9.7) and New Orleans (9.1) follow. Conversely, Rochester (0.9) was the only metro that saw an average increase of less than 1.0. Jacksonville, Fla. (1.1), and San Diego (1.3) follow.
Sangameshwar says that poses significant risks to heat-sensitive and vulnerable populations, including the elderly, children, those with chronic illnesses and people in low-income communities.
"These risks include heat-related illnesses, mental health strain and heat-related deaths, as well as rising energy burdens from a growing demand for cooling," she says. "Without intervention — like expanding cooling infrastructure, mitigating urban heat islands, improving workplace heat protections and implementing localized climate strategies — the health, safety and livelihoods of at-risk residents are likely to deteriorate as heat waves intensify."
In 2023, Texas counties had the most days with extreme heat
Texas was the epicenter of extreme heat in 2023. Of 146 counties that experienced at least 100 days with maximum temperatures at or above 95 degrees, 139 were in Texas. Of these, Dimmit and Zapata counties recorded the most, at 151 days at 95 degrees or higher.
Only seven counties outside Texas made the list: four in Arizona, two in Oklahoma and one in California.
Full rankings: Heat wave changes, 1961 to 2023
Rank | Metro | Change in # of heat waves per year | Change in avg. length of heat waves in days | Estimated change in annual heat wave days | Change in avg. length of annual heat wave season in days |
|---|---|---|---|---|---|
| 1 | New Orleans, LA | 9.1 | 4.5 | 40.8 | 101.4 |
| 2 | Tampa, FL | 10.4 | 2.4 | 25.4 | 96.6 |
| 3 | San Francisco, CA | 7.6 | 3.0 | 22.5 | 109.8 |
| 4 | Fort Worth, TX | 5.3 | 4.0 | 20.9 | 58.0 |
| 5 | Salt Lake City, UT | 5.3 | 3.7 | 19.5 | 52.4 |
| 6 | Las Vegas, NV | 5.9 | 3.3 | 19.3 | 64.5 |
| 7 | Miami, FL | 9.7 | 1.5 | 14.4 | 89.7 |
| 8 | Birmingham, AL | 5.7 | 2.5 | 14.3 | 66.2 |
| 9 | Atlanta, GA | 6.6 | 2.1 | 14.1 | 84.2 |
| 10 | Austin, TX | 7.1 | 2.0 | 13.9 | 62.1 |
| 11 | Norfolk, VA | 5.8 | 2.1 | 12.1 | 73.5 |
| 12 | Phoenix, AZ | 5.7 | 2.1 | 11.9 | 61.2 |
Source: ValuePenguin analysis of Environmental Protection Agency (EPA) data across the largest metros with available data. Notes: We excluded San Juan, Puerto Rico, from our metro-specific analysis. Rankings are based on the estimated change in annual heat wave days.
Full rankings: Counties with at least 100 days of extreme heat, 2023
Rank | State | County | Days with maximum daily temperature of 95°+ |
|---|---|---|---|
| 1 | Texas | Dimmit | 151 |
| 1 | Texas | Zapata | 151 |
| 3 | California | Imperial | 150 |
| 3 | Texas | La Salle | 150 |
| 3 | Texas | Webb | 150 |
| 6 | Texas | Zavala | 148 |
| 7 | Texas | Starr | 146 |
| 8 | Texas | Maverick | 142 |
| 9 | Arizona | Yuma | 141 |
| 10 | Texas | Val Verde | 139 |
| 11 | Arizona | Maricopa | 136 |
| 12 | Texas | McMullen | 134 |
Source: Centers for Disease Control and Prevention (CDC) National Environmental Public Health Tracking Network data. Note: The data excludes Alaska and Hawaii.
Heat-related emergency room visits have risen
As heat events rise, so do heat-related summer emergency department (ED) visits. Across the U.S., 286.3 Americans per 100,000 ED visits from June to August 2024 were seen for heat-related conditions. That’s a 41.4% increase from summer 2020.
Heat-related illnesses can include heat stroke, heat cramps, heat rash, rhabdomyolysis and more.
Looking at Centers for Disease Control and Prevention (CDC) data, four regions saw an increase of over 50.0% during this time. Region 10 — Alaska, Idaho, Oregon, Washington and 271 native tribes — saw the biggest jump at 76.3%. That’s followed by:
- Region 6: Arkansas, Louisiana, New Mexico, Oklahoma and Texas (61.7%)
- Region 9: Arizona, California, Hawaii and Nevada, as well as American Samoa, the Northern Mariana Islands, the Federated States of Micronesia, Guam, Marshall Islands and Palau (59.8%)
- Region 8: Colorado, Montana, North Dakota, South Dakota, Utah and Wyoming (56.9%)
Summer heat-related ED visits per 100,000 ED visits, by region
Region | Avg., summer 2024 | Avg., summer 2023 | Avg., summer 2022 | Avg., summer 2021 | Avg., summer 2020 | Summer avg., 2020-24 | % change, 2020-24 | 2024 difference from 5-year summer avg. |
|---|---|---|---|---|---|---|---|---|
| Region 1 | 135.8 | 84.9 | 124.6 | 143.3 | 115.5 | 120.8 | 17.6% | 12.4% |
| Region 2 | 116.6 | 66.5 | 94.8 | 102.9 | 95.0 | 95.2 | 22.7% | 22.5% |
| Region 3 | 234.8 | 157.7 | 179.4 | 196.1 | 191.4 | 191.9 | 22.7% | 22.4% |
| Region 4 | 303.7 | 325.0 | 267.8 | 187.9 | 234.4 | 263.8 | 29.6% | 15.1% |
| Region 5 | 156.7 | 141.9 | 152.6 | 143.1 | 143.7 | 147.6 | 9.0% | 6.2% |
| Region 6 | 496.1 | 700.9 | 439.3 | 276.7 | 306.8 | 444.0 | 61.7% | 11.7% |
| Region 7 | 419.0 | 485.0 | 419.9 | 358.5 | 321.2 | 400.7 | 30.4% | 4.6% |
| Region 8 | 203.4 | 159.0 | 169.7 | 190.9 | 129.6 | 170.5 | 56.9% | 19.3% |
| Region 9 | 608.5 | 490.7 | 376.3 | 400.4 | 380.7 | 451.3 | 59.8% | 34.8% |
| Region 10 | 188.5 | 172.3 | 223.1 | 364.9 | 106.9 | 211.1 | 76.3% | -10.7% |
| All regions | 286.3 | 278.4 | 244.8 | 236.5 | 202.5 | 249.7 | 41.4% | 14.7% |
Source: LendingTree analysis of CDC National Environmental Public Health Tracking Network data. Notes: The average rates of heat-related ED visits per 100,000 ED visits from 2020 to 2024 are for the summer, defined as June 1 to Aug. 31. Region details can be found here.
Looking at extreme heat risk, three New York counties have the highest percentage of residents socially vulnerable to extreme heat, according to U.S. Census Bureau 2022 Community Resilience Estimates (CRE) data.
In Bronx County, 46.3% of residents have at least three risk factors, ahead of 37.7% in New York County and 36.3% in Kings County.
By state, Alaska (37.9%), New Mexico (32.7%) and New York (30.3%) rank highest.
Full rankings: 100 counties with highest percentage of residents socially vulnerable to extreme heat
Rank | County | % with at least 3 risk factors present | % with no risk factors present |
|---|---|---|---|
| 1 | Bronx County, New York | 46.3% | 11.1% |
| 2 | New York County, New York | 37.7% | 13.0% |
| 3 | Kings County, New York | 36.3% | 14.9% |
| 4 | Hidalgo County, Texas | 34.7% | 17.8% |
| 5 | Queens County, New York | 34.4% | 15.7% |
| 6 | El Paso County, Texas | 34.2% | 18.5% |
| 7 | San Francisco County, California | 34.0% | 18.2% |
| 8 | Kern County, California | 32.1% | 19.4% |
| 9 | Fresno County, California | 32.0% | 21.1% |
| 9 | Philadelphia County, Pennsylvania | 32.0% | 22.7% |
| 11 | San Mateo County, California | 31.9% | 19.8% |
| 12 | Suffolk County, Massachusetts | 31.5% | 24.5% |
Source: ValuePenguin analysis of U.S. Census Bureau 2022 Community Resilience Estimates (CRE) data.
Full rankings: States with highest percentage of residents socially vulnerable to extreme heat
Rank | State | % with at least 3 risk factors present | % with no risk factors present |
|---|---|---|---|
| 1 | Alaska | 37.9% | 10.8% |
| 2 | New Mexico | 32.7% | 21.9% |
| 3 | New York | 30.3% | 25.4% |
| 4 | Mississippi | 30.0% | 26.9% |
| 5 | Hawaii | 29.8% | 19.9% |
| 6 | California | 29.5% | 21.9% |
| 7 | Montana | 29.3% | 23.6% |
| 8 | Louisiana | 28.3% | 27.9% |
| 9 | West Virginia | 28.2% | 30.5% |
| 10 | Wyoming | 28.1% | 26.2% |
| 11 | Arkansas | 27.8% | 27.9% |
| 12 | Oregon | 27.7% | 26.4% |
Source: ValuePenguin analysis of U.S. Census Bureau 2022 CRE data.
Heat causes more deaths than flooding or tornadoes
The risk of heat can often be understated, particularly compared to other disasters. However, heat has caused more deaths over the past 30 years than flooding or tornadoes — in fact, 5,971 deaths have been classified as heat-related since 1995.
That breaks down to an average of 199 deaths a year from 1995 to 2024. Comparatively, the average annual deaths related to flooding are a significantly lower 89 over the same period. Tornadoes (72) and hurricanes (51) also have lower averages.
Heat-related deaths, 1995 to 2024
Year | Heat-related deaths |
|---|---|
| 2024 | 177 |
| 2023 | 555 |
| 2022 | 383 |
| 2021 | 375 |
| 2020 | 350 |
| 2019 | 187 |
| 2018 | 108 |
| 2017 | 107 |
| 2016 | 94 |
| 2015 | 45 |
| 2014 | 20 |
| 2013 | 92 |
Source: ValuePenguin analysis of National Weather Service (NWS) data.
By year, 1995 had the most heat-related deaths at 1,021. That can largely be attributed to one major heat wave in July that severely affected Southeast Wisconsin and Chicago.
2023 follows, with 555 deaths. During this time, record-high ocean temperatures led to a long-lasting heat wave over the Southwest U.S. from mid-June to early August.
Sangameshwar says most Americans will be surprised to learn that heat has caused more deaths over the past 30 years than flooding or high-profile disasters like hurricanes and tornadoes.
"Heat waves are often understated compared to other natural events due to a lack of visual damage, the gradual onset of heat-related deaths and public misconception that heat is survivable," she says. "Additionally, the number of heat-related deaths could be significantly higher, as deaths caused by the heat exacerbating preexisting conditions aren’t always attributed to heat. This further obscures the mortal danger heat poses. Treating heat waves as a public health crisis rather than a seasonal nuisance is essential to raising awareness, improving preparedness and saving lives."
Preparing for heat: Top expert tips
Heat is no joke, and Sangameshwar says every American should take some time to educate themselves on extreme heat and its potential impact on themselves and their family. Here’s how else Americans can prepare for heat waves or extreme heat:
- Keep enough clean drinking water on hand and stay hydrated. Water is best. Avoid sugary or alcoholic beverages during a heat wave, as they can accelerate dehydration and worsen heat injury.
- Check, clean or fix air conditioners and air filters to make sure they’re operating at peak efficiency to save on energy costs. Additionally, identify local cooling centers near home in case you need a place to cool down if air conditioners stop working.
- Don’t be afraid to seek help. The Low-Income Home Energy Assistance Program (LIHEAP) can help you pay home energy bills, repair or replace AC units, make homes more heat-resilient or get transportation to community cooling centers — all crucial to keeping cool in the heat.
Methodology
ValuePenguin researchers analyzed Environmental Protection Agency (EPA) heat wave data by frequency, duration, days, season and intensity from the 1960s through 2020s (ending in 2023). The 1960s data represents the average from 1961 to 1970, the 1970s are 1971 to 1980 and so on. The 2020s are a partial decade, reflecting 2021 to 2023.
Per the EPA, a heat wave is defined as a "period of two or more consecutive days when the daily minimum apparent temperature (the actual temperature adjusted for humidity) in a particular city exceeds the 85th percentile of historical July and August temperatures (1981-2010) for that city."
We ranked the 49 largest U.S. metros with available data by the estimated change in annual heat wave days between 1961 and 2023, calculated by multiplying the change in the number of heat waves by the change in the length of individual heat waves in days. (We excluded San Juan, Puerto Rico, from our metro-specific analysis. Key large metros — such as New York, Houston, Washington, D.C., and Minneapolis — were excluded by the EPA because of data or station issues.)
We analyzed the Centers for Disease Control and Prevention (CDC) National Environmental Public Health Tracking Network county-level data on extreme heat days in 2023. Extreme heat days were defined as days with a maximum temperature at or above 95 degrees. This data excludes Alaska and Hawaii.
Analysts utilized average rates of heat-related emergency department visits per 100,000 ED visits, via the CDC National Environmental Public Health Tracking Network. Analysts used daily rates to calculate the average rate of summer heat-related ED visits per 100,000 ED visits for each region and overall, covering June 1 to Aug. 31 from 2020 through 2024. Region details can be found here.
Researchers analyzed U.S. Census Bureau 2022 Community Resilience Estimates (CRE) data on the counties and states most socially vulnerable to extreme heat.
Lastly, researchers analyzed National Weather Service (NWS) data on heat-related deaths from 1995 to 2024.
About the Author

Writer, Consumer Research
Maggie Davis is a staff writer at ValuePenguin. She primarily focuses on breaking down complex data and research about the financial lives of Americans into digestible content through our studies and surveys. Her reporting has been featured in numerous publications, such as Forbes and USA Today.
Education
- BA, Journalism, Pepperdine University
Editorial note: The content of this article is based on the author's opinions and recommendations alone. It has not been previewed, commissioned or otherwise endorsed by any of our network partners.